10-K: Annual report pursuant to Section 13 and 15(d)
Published on March 14, 2013
Table of Contents
Index to Financial Statements
UNITED STATES
SECURITIES AND EXCHANGE COMMISSION
Washington, D.C. 20549
FORM 10-K
(Mark One)
| x | ANNUAL REPORT PURSUANT TO SECTION 13 OR 15(d) OF THE SECURITIES EXCHANGE ACT OF 1934 |
For the fiscal year ended December 31, 2012
OR
| ¨ | TRANSITION REPORT PURSUANT TO SECTION 13 OR 15(d) OF THE SECURITIES EXCHANGE ACT OF 1934 |
For the transition period from to
Commission file number: 1-32167
VAALCO Energy, Inc.
(Exact name of registrant as specified on its charter)
| Delaware | 76-0274813 | |
| (State or other jurisdiction of incorporation or organization) |
(I.R.S. Employer Identification No.) |
4600 Post Oak Place
Suite 300
Houston, Texas 77027
(Address of principal executive offices) (Zip Code)
(Registrants telephone number, including area code): (713) 623-0801
Securities registered under Section 12(b) of the Exchange Act:
| Title of each class |
Name of exchange on which registered |
|
| Common Stock, $.10 par value | New York Stock Exchange |
Securities registered under Section 12(g) of the Exchange Act:
None
Indicate by check mark if the registrant is a well-known seasoned issuer as defined in Rule 405 of the Securities Act. Yes No X
Indicate by check mark if the registrant is not required to file reports pursuant to Section 13 or Section 15d of the Act. Yes No X
Indicate by check mark whether the registrant (1) has filed all reports required to be filed by Section 13 or 15(d) of the Securities Exchange Act of 1934 during the preceding 12 months (or for such shorter period that the registrant was required to file such reports), and (2) has been subject to such filing requirements for the past 90 days. Yes X No
Indicate by check mark whether the registrant has submitted electronically and posted on its corporate website, if any, every Interactive Data File required to be submitted and posted pursuant to Rule 405 of Regulation S-T during the preceding 12 months (or such shorter period that the registrant was required to submit and post such files). Yes X No
Indicate by check mark if disclosure of delinquent filers pursuant to Item 405 of Regulation S-K is not contained herein, and will not be contained, to the best of registrants knowledge, in definitive proxy or information statements incorporated by reference in Part III of this Form 10 K or any amendment to this Form 10-K. X
Indicate by check mark whether the registrant is a large accelerated filer, an accelerated filer, a non-accelerated filer or a smaller reporting company. See the definitions of large accelerated filer, accelerated filer, and smaller reporting company in Rule 12b-2 of the Exchange Act.
Large accelerated filer Accelerated filer X Non-accelerated filer Smaller reporting company
Indicate by check mark whether the registrant is a shell company (as defined in Rule 12b-2 of the Exchange Act). Yes No X
The aggregate market value of the voting and non-voting common equity of the registrant held by non-affiliates, as of June 30, 2012 was $499,209,245 based on a closing price of $8.63 on June 29, 2012.
As of February 28, 2013, there were outstanding 57,909,800 shares of common stock, $0.10 par value per share, of the registrant.
Documents incorporated by reference: Definitive proxy statement of VAALCO Energy, Inc. relating to the Annual Meeting of Stockholders to be filed within 120 days after the end of the fiscal year covered by this Form 10-K, which is incorporated into Part III of this Form 10-K.
Table of Contents
Index to Financial Statements
VAALCO ENERGY, INC.
2
Table of Contents
Index to Financial Statements
Terms used to describe quantities of oil and natural gas
| | BblOne stock tank barrel, or 42 US gallons liquid volume, of crude oil or other liquid hydrocarbons. |
| | BOEOne barrel of oil equivalent, converting gas to oil at the ratio of 6 Mcf of gas to 1 Bbl of oil. The ratio of six Mcf of natural gas to one Bbl of oil or natural gas liquids is commonly used in the oil and gas business and represents the approximate energy equivalency of six Mcf of natural gas to one Bbl of oil or liquids, and does not represent the sales price equivalency of natural gas to oil or liquids. Currently, the sales price of Bbl of oil or natural gas liquids is significantly higher than the sales price of six Mcf of natural gas. |
| | BOPDOne barrel of oil per day. |
| | MBblOne thousand Bbls. |
| | McfOne thousand cubic feet of natural gas. |
| | MMcfOne million cubic feet of natural gas. |
Terms used to describe the Companys interests in wells and acreage
| | Gross oil and gas wells or acresThe Companys gross wells or gross acres represent the total number of wells or acres in which the Company owns a working interest. |
| | Net oil and gas wells or acresDetermined by multiplying gross oil and natural gas wells or acres by the working interest that the Company owns in such wells or acres represented by the underlying properties. |
Terms used to assign a present value to the Companys reserves
| | Standard measure of proved reservesThe present value, discounted at 10%, of the future net cash flows attributable to estimated net proved reserves. The Company calculates this amount by assuming that it will sell the oil and gas production attributable to the proved reserves estimated in its independent engineers reserve report for the prices used in the report, unless it had a contract to sell the production for a different price. The Company also assumes that the cost to produce the reserves will remain constant at the costs prevailing on the date of the report. The assumed costs are subtracted from the assumed revenues resulting in a stream of future net cash flows. Estimated future income taxes using rates in effect on the date of the report are deducted from the net cash flow stream. The after-tax cash flows are discounted at 10% to result in the standardized measure of the Companys proved reserves. |
Terms used to classify the Companys reserve quantities
| | Developed oil and gas reserves. Developed oil and gas reserves are reserves of any category that can be expected to be recovered: |
| (i) | Through existing wells with existing equipment and operating methods or in which the cost of the required equipment is relatively minor compared to the cost of a new well; and |
| (ii) | Through installed extraction equipment and infrastructure operational at the time of the reserves estimate if the extraction is by means not involving a well. |
| | Proved oil and gas reserves. Proved oil and gas reserves are those quantities of oil and gas, which, by analysis of geoscience and engineering data, can be estimated with reasonable certainty to be |
3
Table of Contents
Index to Financial Statements
| economically produciblefrom a given date forward, from known reservoirs, and under existing economic conditions, operating methods, and government regulationsprior to the time at which contracts providing the right to operate expire, unless evidence indicates that renewal is reasonably certain, regardless of whether deterministic or probabilistic methods are used for the estimation. The project to extract the hydrocarbons must have commenced or the operator must be reasonably certain that it will commence the project within a reasonable time. |
| (i) | The area of the reservoir considered as proved includes: |
| (A) | The area identified by drilling and limited by fluid contacts, if any, and |
| (B) | Adjacent undrilled portions of the reservoir that can, with reasonable certainty, be judged to be continuous with it and to contain economically producible oil or gas on the basis of available geoscience and engineering data. |
| (ii) | In the absence of data on fluid contacts, proved quantities in a reservoir are limited by the lowest known hydrocarbons (LKH) as seen in a well penetration unless geoscience, engineering, or performance data and reliable technology establishes a lower contact with reasonable certainty. |
| (iii) | Where direct observation from well penetrations has defined a highest known oil (HKO) elevation and the potential exists for an associated gas cap, proved oil reserves may be assigned in the structurally higher portions of the reservoir only if geoscience, engineering, or performance data and reliable technology establish the higher contact with reasonable certainty. |
| (iv) | Reserves which can be produced economically through application of improved recovery techniques (including, but not limited to, fluid injection) are included in the proved classification when: |
| (A) | Successful testing by a pilot project in an area of the reservoir with properties no more favorable than in the reservoir as a whole, the operation of an installed program in the reservoir or an analogous reservoir, or other evidence using reliable technology establishes the reasonable certainty of the engineering analysis on which the project or program was based; and |
| (B) | The project has been approved for development by all necessary parties and entities, including governmental entities. |
| (v) | Existing economic conditions include prices and costs at which economic producibility from a reservoir is to be determined. The price shall be the average price during the 12-month period prior to the ending date of the period covered by the report, determined as an unweighted arithmetic average of the first-day-of-the-month price for each month within such period, unless prices are defined by contractual arrangements, excluding escalations based upon future conditions. |
| | Reserves. Reserves are estimated remaining quantities of oil and gas and related substances anticipated to be economically producible, as of a given date, by application of development projects to known accumulations. In addition, there must exist, or there must be a reasonable expectation that there will exist, the legal right to produce or a revenue interest in the production, installed means of delivering oil and gas or related substances to market, and all permits and financing required to implement the project. |
| | Standardized measure. Standardized measure is the present value of estimated future net revenues to be generated from the production of proved reserves, determined in accordance with the rules and regulations of the Securities and Exchange Commission, using prices and costs in effect as of the date of estimation, without giving effect to nonproperty related expenses such as certain general and administrative expenses, debt service and future federal income tax expenses or to depreciation, depletion and amortization and discounted using an annual discount rate of 10%. |
4
Table of Contents
Index to Financial Statements
| | Undeveloped oil and gas reserves. Undeveloped oil and gas reserves are reserves of any category that are expected to be recovered from new wells on undrilled acreage, or from existing wells where a relatively major expenditure is required for recompletion. |
| (i) | Reserves on undrilled acreage shall be limited to those directly offsetting development spacing areas that are reasonably certain of production when drilled, unless evidence using reliable technology exists that establishes reasonable certainty of economic producibility at greater distances. |
| (ii) | Undrilled locations can be classified as having undeveloped reserves only if a development plan has been adopted indicating that they are scheduled to be drilled within five years, unless the specific circumstances, justify a longer time. |
| (iii) | Under no circumstances shall estimates for undeveloped reserves be attributable to any acreage for which an application of fluid injection or other improved recovery technique is contemplated, unless such techniques have been proved effective by actual projects in the same reservoir or an analogous reservoir, or by other evidence using reliable technology establishing reasonable certainty. |
| | Unproved properties. Properties with no proved reserves. |
Terms which describe the productive life of a property or group of properties
| | Reserve life. A measure of the productive life of an oil and gas property or a group of oil and gas properties, expressed in years. Reserve life for the years ended December 31, 2012, 2011 or 2010 equal the estimated net proved reserves attributable to a property or group of properties divided by production from the property or group of properties for the four fiscal quarters preceding the date as of which the proved reserves were estimated. |
Terms used to describe the legal ownership of the Companys oil and gas properties
| | Royalty interest. A real property interest entitling the owner to receive a specified portion of the gross proceeds of the sale of oil and natural gas production or, if the conveyance creating the interest provides, a specific portion of oil and natural gas produced, without any deduction for the costs to explore for, develop or produce the oil and natural gas. A royalty interest owner has no right to consent to or approve the operation and development of the property, while the owners of the working interests have the exclusive right to exploit the minerals on the land. |
| | Working interest. A real property interest entitling the owner to receive a specified percentage of the proceeds of the sale of oil and natural gas production or a percentage of the production, but requiring the owner of the working interest to bear the cost to explore for, develop and produce such oil and natural gas. A working interest owner who owns a portion of the working interest may participate either as operator or by voting his percentage interest to approve or disapprove the appointment of an operator and drilling and other major activities in connection with the development and operation of a property. |
Terms used to describe seismic operations
| | Seismic data. Oil and gas companies use seismic data as their principal source of information to locate oil and gas deposits, both to aid in exploration for new deposits and to manage or enhance production from known reservoirs. To gather seismic data, an energy source is used to send sound waves into the subsurface strata. These waves are reflected back to the surface by underground formations, where they are detected by geophones which digitize and record the reflected waves. Computers are then used to process the raw data to develop an image of underground formations. |
5
Table of Contents
Index to Financial Statements
| | 2-D seismic data. 2-D seismic survey data has been the standard acquisition technique used to image geologic formations over a broad area. 2-D seismic data is collected by a single line of energy sources which reflect seismic waves to a single line of geophones. When processed, 2-D seismic data produces an image of a single vertical plane of sub-surface data. |
| | 3-D seismic data. 3-D seismic data is collected using a grid of energy sources, which are generally spread over several miles. A 3-D survey produces a three dimensional image of the subsurface geology by collecting seismic data along parallel lines and creating a cube of information that can be divided into various planes, thus improving visualization. Consequently, 3-D seismic data is a more reliable indicator of potential oil and natural gas reservoirs in the area evaluated. |
6
Table of Contents
Index to Financial Statements
| Item 1. | Business |
BACKGROUND
VAALCO Energy, Inc., a Delaware corporation incorporated in 1985, is a Houston-based independent energy company principally engaged in the acquisition, exploration, development and production of crude oil and natural gas. VAALCO owns producing properties and conducts exploration activities as an operator in Gabon, West Africa, conducts exploration activities as an operator in Angola, West Africa, conducts exploration activities as a non-operator in Equatorial Guinea, West Africa, and has conducted exploration activities as a non-operator in the British North Sea. VAALCO is the operator of unconventional and conventional resource properties in the United States located in Montana, South Dakota, and North Texas. The Company also owns minor interests in conventional production activities as a non-operator in the United States. As used in this report, the terms Company, we, us, our, and VAALCO mean VAALCO Energy, Inc. and its subsidiaries, unless the context otherwise requires. The Companys corporate headquarters are located at 4600 Post Oak Place, Suite 300, Houston, Texas 77027 where the telephone number is (713) 623-0801.
VAALCOs international subsidiaries are VAALCO Gabon (Etame), Inc., VAALCO Production (Gabon), Inc., VAALCO Angola (Kwanza), Inc., VAALCO UK (North Sea), Ltd., VAALCO International, Inc., VAALCO Energy (EG), Inc. and VAALCO Energy Mauritius (EG) Limited. VAALCO Energy (USA), Inc. holds interests in properties located in the United States.
STRATEGY
International
The Companys international strategy is to pursue selective opportunities with a focus on West Africa that are characterized by reasonable entry costs, favorable economic terms, high reserve potential relative to capital expenditures and the availability of existing technical data that may be further developed. The Company believes that it has strong management and technical expertise with proven abilities in identifying international opportunities and establishing favorable operating relationships with host governments and local partners familiar with the local practices and infrastructure. The Company owns producing properties and conducts exploration activities as operator of two exploration licenses in Gabon, one exploration license in Angola, and as non-operator of one exploration license in Equatorial Guinea.
In addition, the Companys production strategy is to maximize the value of the reserves discovered in Gabon through exploitation of the offshore Etame Marin block (comprised of the Etame, Avouma, South Tchibala, and Ebouri producing fields, the Southeast Etame and North Tchibala fields currently being developed), and the onshore Mutamba Iroru block (NGongui field currently being developed).
Domestic
The Companys domestic strategy is to selectively acquire resource based properties, including liquids-rich shale properties. In 2010 and 2011, the Company acquired a total of two small leases in the Granite Wash formation in Texas, followed by two larger properties acquired in 2011 located in the Middle Bakken formation in Montana, and one property acquired in 2012 located in the Red River formation in South Dakota. With the limited drilling success experienced in 2012 on the recently acquired properties, the Company expects to be very selective on future domestic property acquisitions.
RECENT DEVELOPMENTS
Offshore Gabon
The Companys primary source of revenue is from the Etame Production Sharing Contract related to the Etame Marin block located offshore the Republic of Gabon. VAALCO operates the Etame Marin block on behalf
7
Table of Contents
Index to Financial Statements
of a consortium of companies. At December 31, 2012, VAALCO owned a 30.35% interest in the exploration acreage within the Etame Marin block. The Company owns a 28.1% interest in the development areas in and surrounding the Etame, Avouma, South Tchibala, and Ebouri fields, each of which is located on the Etame Marin block. The development areas were subject to a 7.5% back-in by the Government of Gabon, which occurred for these fields after their successful development. The Southeast Etame and North Tchibala fields, each of which is also located on the Etame Marine block are in the process of being developed and will also be subject to a 7.5% back-in by the Government of Gabon.
The Company produces from the Etame, Avouma, South Tchibala and Ebouri fields on the block. During 2012, these fields produced approximately 7.0 million Bbls (2.0 million Bbls net to the Company). The Companys share of barrels sold reflects an allocation of cost oil and profit oil, and a reduction for royalty (13%).
In July 2012, the Company discovered the presence of hydrogen sulfide (H2S) from two of the three producing wells in the Ebouri field. The wells were shut-in for safety reasons resulting in a decrease of approximately 2,000 BOPD or approximately 10% of the gross daily production from the Etame Marin block. Analysis and options for re-establishing production from the impacted area was undertaken in the second half of 2012. The expected outcome is that additional capital investment will be required, which is likely to include a new platform-type structure with H2S processing capability, and new wells to re-establish production from the impacted area. The design, cost projections and final investment decisions by the Company and its partners are expected to be made in 2013. Re-establishing production from the area impacted by H2S is expected in the first half of 2016.
During 2011 and 2012, the Company invested in platform modifications to both the Ebouri and Avouma offshore platforms to accommodate the drilling of additional wells in addition to upgrading the electrical and power generation systems on both platforms. A new personnel accommodation module was installed during 2012 at the Avouma platform. In 2012, the Company also finished the construction and installation of water knock-out facilities at the Avouma platform. The water knock-out facilities are expected to go on-line in the first half of 2013.
The Company and its partners approved the construction of two additional production platforms in late 2012. One platform will be located in the Etame field and the second platform will be located in-between the Southeast Etame and North Tchibala fields. Multiple wells are expected to be drilled from each of the platforms as part of the future development plans for the Etame Marin block. The Company drilled a successful exploration well in the Southeast Etame area in 2010, which will be developed from the second platform. The expected cost to build and install the platforms during the 2013/2014 timeframe is $275.0 million ($77.0 million net to the Company). The cost of the wells is not included in the platform costs.
A six-well drilling program commenced in December 2012 that includes an exploration well, a development well in the Avouma field, an exploration appraisal well to be drilled in the Ebouri field and three well recompletions to replace electrical submersible pumps.
Onshore Gabon
The Company executed a farm-out agreement in August 2010 with Total Gabon on the Mutamba Iroru block located onshore near the coast in central Gabon. The Mutamba Iroru block contains an exploration area of approximately 270,000 acres. The Company has a 50% working interest on the block. Under the terms of the agreement, the Company and Total Gabon committed to reprocess 400 kilometers of 2-D seismic data and drill one exploration well. The seismic reprocessing work was completed in 2012. The exploration well was drilled in 2012 resulting in a discovery at a cost of $17.1 million ($5.3 million net to the Company). A plan of development is expected to be completed for the NGongui field and submitted to the government of Gabon in 2013.
In 2010, the exploration permit was successfully extended until May 2012 and an application for a further nine-month extension was made in early 2012. In a letter agreement from the government of Gabon, the terms of
8
Table of Contents
Index to Financial Statements
the extension to March 2013 were agreed upon, yet the extension amendment was not executed by the government of Gabon. The Company and Total are working with the Gabon government in 2013 to finalize the extension and to obtain a further exploration extension. However, the Company can provide no assurances that such a request will be granted. The Company believes the discovery area is not impacted by the uncertainty of the extension agreement as the well was drilled during the contracted period and application of the discovery was timely made to the government of Gabon.
Offshore Angola
In November 2006, the Company signed a production sharing contract for Block 5 offshore Angola. The four year primary term with an optional three year extension awards the Company exploration rights to 1.4 million acres offshore central Angola. The Companys working interest is 40%.
By a governmental decree dated December 1, 2010, the government-assigned working interest partner was removed from the production sharing contract for cause, and a one year time extension was granted for drilling the two exploration commitment wells. In early 2012, the Angolan government granted a further one year extension to November 30, 2012 for drilling the two exploration commitment wells in accordance with the production sharing contract. In July 2012, the Angolan government granted an additional two year extension until November 30, 2014 to drill the two exploration commitment wells.
In the second quarter of 2012, the Company identified a potential partner to acquire the available 40% working interest and submitted the name of the interested party to the Angolan government for approval. In November 2012, the government advised the Company that it has entered into negotiations with the potential partner. The Company met with the Angolan government in January 2013 and learned the negotiations are still underway.
Offshore Equatorial Guinea
In July 2012, the Company signed a definitive agreement with PETRONAS CARIGALI OVERSEAS SDN BHD for the purchase of a 31% working interest in Block P, located offshore Equatorial Guinea at a cost of $10.0 million. The acquisition was completed on November 1, 2012. The Company expects two exploration wells will be drilled on this block in 2013 or 2014. GEPetrol, the national oil company of Equatorial Guinea, is the operator of the block.
Onshore DomesticTexas
The Company acquired a 640 acre lease, the Hefley field, in the Granite Wash formation in North Texas in December 2010 and a 480 acre lease in the same formation in July 2011. Production from a second well in the Hefley field began in April, 2012. During 2012, the two wells produced approximately 10,000 Bbls of oil and 519 million cubic feet of gas net to the Company after deduction of royalty and severance taxes. A financial impairment of $7.6 million was recorded for the Hefley field in the third quarter of 2012 on the basis of production performance, projected hydrocarbon price curves, operating expenses and estimated reserves.
The Hefley field acreage is held by production. The expiration date of the primary term of the second Granite Wash lease is August 2014.
Onshore DomesticMontana
In May 2011, the Company acquired a 70% working interest in approximately 5,200 acres (3,640 net acres) in Sheridan County, Montana in the Middle Bakken formation. The Company drilled two wells on this acreage in 2012. After completion testing beginning in the fourth quarter of 2012 using electrical submersible pumps
9
Table of Contents
Index to Financial Statements
(ESPs), both of the wells drilled have been determined to be unsuccessful as the operating and water disposal costs exceeded the value of the gas and condensate produced from the wells. Dry hole cost and leasehold impairment totaling $14.2 million was recognized in the fourth quarter of 2012 related to these two wells.
In September 2011, the Company acquired a 65% working interest in approximately 22,000 gross acres (14,300 net acres) covering the Middle Bakken and deeper formations in the East Poplar unit and the Northwest Poplar field in Roosevelt County, Montana. Pursuant to the terms of the acquisition, the Company was required to drill three wells at its sole cost, one of which was required to be drilled by June 1, 2012 and the remaining two wells were required to be drilled by the end of 2012. A vertical exploration well, which met the time requirement for drilling the first well, was spudded in December 2011 to evaluate the formations. The second exploration well was drilled and completed in the Bakken/Three Forks formations. Both of these wells were unsuccessful efforts, resulting in dry hole costs and leasehold impairment totaling $18.4 million recorded in the fourth quarter of 2012. The third obligatory well began drilling in December 2012 and is scheduled for completion testing in the Nisku formation in the first half of 2013.
Onshore DomesticSouth Dakota
In September 2012, the Company acquired a 100% working interest in approximately 10,000 acres in Harding County, South Dakota, for $1.5 million. The primary objective for this property is the Red River formation. Pursuant to the terms of the acquisition, the Company is obligated to drill and complete a well, or reenter and complete an existing well within twelve months of the acquisition date. Once this obligation is met and within sixteen months of the acquisition date, the Company must elect to proceed or withdraw from the transaction. Should the Company elect to proceed, it must pay an additional amount of approximately $3.6 million and commit to drill and complete an additional well, or reenter and complete another existing well within twelve months of the date the Company elects to proceed with the transaction. The Company drilled the initial well on the property in the first quarter of 2013, an unsuccessful effort at a cost of approximately $2.9 million. The Company will record this amount as dry hole cost in the first quarter of 2013. The Company does not have plans to proceed with additional investments on this property.
AVAILABLE INFORMATION
The Company files annual, quarterly and current reports, proxy statements and other information with the Securities and Exchange Commission (SEC). You may read and copy any document the Company files at the SECs Public Reference Room at 100 F Street, N.E., Washington, D.C. 20549. Please call the SEC at 1-800-SEC-0330 for further information on the SECs Public Reference Room. The Companys SEC filings are also available to the public at the SECs website at www.sec.gov.
You may also obtain copies of the Companys annual, quarterly and current reports, proxy statements and certain other information filed with the SEC, as well as amendments thereto, free of charge from the Companys website at www.vaalco.com. No information from the SECs or the Companys website is incorporated by reference herein. The Company has placed on its website copies of its Audit Committee Charter, Code of Business Conduct and Ethics, and Code of Ethics for the Chief Executive Officer and Chief Financial Officer. Stockholders may request a printed copy of these governance materials by writing to the Corporate Secretary, VAALCO Energy, Inc., 4600 Post Oak Place, Suite 300, Houston, Texas 77027.
CUSTOMERS
Substantially all of the Companys oil and gas is sold at posted or indexed prices under short-term contracts, as is customary in the industry. In Gabon, the Company sold oil under contracts with Mercuria Trading NV (Mercuria) in 2012 and 2011. In 2010, the Company sold its Gabon oil to Vitol S.A. In both 2012 and 2011, approximately 99% of total sales were made to Mercuria. In 2010, approximately 100% of total sales were made
10
Table of Contents
Index to Financial Statements
to Vitol S.A. For the 2013 calendar year, the Company will also sell its oil under a contract with Mercuria. While the loss of Mercuria as a buyer might have a material effect on the Company in the short term, management believes that the Company would be able to obtain other customers for its crude oil.
Domestic operated production in Texas is sold via two contracts, one for oil and one for gas and natural gas liquids. The Company has access to several alternative buyers for oil, gas, and natural gas liquids domestically.
EMPLOYEES
As of December 31, 2012, the Company had 103 full-time employees and consultant contractors, 55 of whom were located in Gabon and 8 of whom were located in Angola. The Company is not yet subject to any collective bargaining agreements, although most of the national employees in Gabon are members of the NEOP (National Organization of Petroleum Workers) union. The Company believes its relations with its employees are satisfactory.
COMPETITION
The oil and gas industry is highly competitive. Competition is particularly intense from other independent operators and from major oil and natural gas companies with respect to acquisitions of desirable oil and gas properties and contracting for drilling equipment. There is also competition for the hiring of experienced personnel. In addition, the drilling, producing, processing and marketing of oil and gas is affected by a number of factors beyond the control of the Company, including but not limited to shortages of drilling rigs, pipe and personnel, which may delay drilling, increase prices and have other adverse effects which cannot be accurately predicted.
The Companys competition for acquisitions, exploration, development and production includes the major oil and gas companies in addition to numerous independent oil companies, individual proprietors, investors and others. Many of these competitors possess financial, technical and personnel resources substantially in excess of those available to the Company, giving those competitors an enhanced ability to evaluate and acquire desirable leases properties or prospects. The ability of the Company to generate reserves in the future will depend on its ability to select and acquire suitable producing properties and prospects for future drilling and exploration.
INSURANCE
In accordance with industry practice, the Company maintains insurance against some, but not all, of the operating risks to which its business is exposed. The Company currently has insurance policies that include coverage for general liability (includes sudden and accidental pollution), physical damage to its oil and gas properties, operational control of offshore wells, aviation, auto liability, marine liability, workers compensation and employers liability, among other things. At the depths and in the areas in which the Company operates, and in light of the vertical and horizontal drilling that it undertakes, the Company typically does not encounter high pressures or extreme drilling conditions.
Currently, the Company has Operators Extra Expense insurance coverage up to $100 million per occurrence, which includes damage to equipment and sudden and accidental environmental liability coverage. The Companys insurance policies contain maximum policy limits and in most cases, deductibles (generally ranging from $100,000 to $1 million) that must be met prior to recovery. These insurance policies are subject to certain customary exclusions and limitations. In addition, the Company carries $75 million of general liability insurance to cover bodily injury, property damage and pollution affecting third parties arising from its operations.
The Company requires all of its third-party contractors to sign master service agreements in which they agree to indemnify the Company for injuries and deaths of the service providers employees as well as
11
Table of Contents
Index to Financial Statements
contractors and subcontractors hired by the service provider. Similarly, the Company generally agrees to indemnify each third-party contractor against claims made by the Companys employees and other contractors. Additionally, each party generally is responsible for damage to its own property.
The third-party contractors that perform hydraulic fracturing operations for the Company sign the master service agreements containing the indemnification provisions noted above. The Company does not currently have any insurance policies in effect that are intended to provide coverage for losses solely related to hydraulic fracturing operations. However, the Company believes its general liability and excess liability insurance policies would cover third party claims related to hydraulic fracturing operations and associated legal expenses, in accordance with, and subject to, the terms of such policies.
The Company re-evaluates the purchase of insurance, coverage limits and deductibles annually. Future insurance coverage for the oil and gas industry could increase in cost and may include higher deductibles or retentions. In addition, some forms of insurance may become unavailable in the future or unavailable on terms that are economically acceptable. No assurance can be given that the Company will be able to maintain insurance in the future at rates that we consider reasonable and it may elect to self-insure or maintain only catastrophic coverage for certain risks in the future.
ENVIRONMENTAL REGULATIONS
General
The Companys activities are subject to federal, state and local laws and regulations governing environmental quality and pollution control in the United States, Gabon and Great Britain and will be subject to the laws and regulations of Angola and Equatorial Guinea when exploration drilling begins in those countries. Although no assurances can be made, the Company believes that, absent the occurrence of an extraordinary event, compliance with existing laws, rules and regulations regulating the release of materials in the environment or otherwise relating to the protection of the environment will not have a material effect upon the Companys capital expenditures, earnings or competitive position with respect to its existing assets and operations. The Company cannot predict what effect future regulation or legislation, enforcement policies, and claims for damages to property, employees, other persons and the environment resulting from the Companys operations could have on its activities. In part because they are developing countries, it is unclear how quickly and to what extent Gabon, Angola or Equatorial Guinea will increase their regulation of environmental issues in the future; any significant increase in the regulation or enforcement of environmental issues by Gabon, Angola or Equatorial Guinea could have a material effect on the Company. Developing countries, in certain instances, have patterned environmental laws after those in the United States which are discussed below. However, the extent to which any environmental laws are enforced in developing countries varies significantly.
In the United States, environmental laws and regulations may require the acquisition of permits before drilling commences, the installation of pollution control equipment for our operations, special handling or disposal of materials used in our operations, or remedial measures to mitigate pollution from our operations or on the properties on which we operate. These laws and regulations may also restrict the types of substances used in our drilling operations which can be used or released into the environment or limit or prohibit drilling activities on certain lands such as wetlands or sensitive protected areas.
As a general matter, the oil and gas exploration and production industry has been the subject of increasing scrutiny and regulation by environmental authorities. The trend has been the enactment of new or more stringent requirements on the oil and gas industry. These changes result in increased operating costs, and additional changes could results in further increases in our costs for environmental compliance.
12
Table of Contents
Index to Financial Statements
Environmental Regulations in the United States
Superfund
The Company currently owns or leases, and in the past has owned or leased, properties that have been used for the exploration and production of oil and gas for many years. Although the Company has utilized operating and disposal practices that were standard in the industry at the time, hydrocarbons or other solid wastes may have been disposed or released on or under the properties owned or leased by the Company or on or under locations where such wastes have been taken for disposal. In addition, some of these properties are or have been operated by third parties. The Company has no control over such entities treatment of hydrocarbons or other solid wastes and the manner in which such substances may have been disposed or released. State and federal laws applicable to oil and gas wastes and properties have gradually become stricter over time. The Company could, in the future, be required to remediate property, including groundwater, containing or impacted by previously disposed wastes (including wastes disposed or released by prior owners or operators, or property contamination, including groundwater contamination by prior owners or operators) or to perform remedial plugging operations to prevent future or mitigate existing contamination.
The federal Comprehensive Environmental Response, Compensation and Liability Act (CERCLA), also known as the Superfund law, generally imposes joint and several liability for costs of investigation and remediation and for natural resource damages, without regard to fault or the legality of the original conduct, on certain classes of persons with respect to the release into the environment of substances designated under CERCLA as hazardous substances (Hazardous Substances). These classes of persons, or so-called potentially responsible parties (PRPs), include the current and certain past owners and operators of a facility where there has been a release or threat of release of a Hazardous Substance and persons who disposed of or arranged for the disposal of Hazardous Substances found at a facility. CERCLA also authorizes the Environmental Protection Agency (the EPA) and, in some cases, third parties to take actions in response to threats to the public health or the environment and to seek to recover from the PRPs the costs of such action.
Although CERCLA generally exempts petroleum from the definition of Hazardous Substance, in the course of its operations, the Company has generated and will generate substances that may fall within CERCLAs definition of Hazardous Substance and may have disposed of these substances at disposal sites owned and operated by others. The Company may also be the owner or operator of sites on which Hazardous Substances have been released. To its knowledge, neither the Company nor its predecessors have been designated as a PRP by the EPA under CERCLA; the Company also does not know of any prior owners or operators of its properties that are named as PRPs related to their ownership or operation of such properties. States such as Texas have comparable statutes which may cover substances (including petroleum) in addition to those covered under CERCLA. In the event contamination is discovered at a site on which the Company is or has been an owner or operator or to which the Company sent regulated substances, the Company could be liable for costs of investigation and remediation and natural resources damages.
The Company generates wastes, including hazardous wastes that are subject to the federal Resource Conservation and Recovery Act (RCRA) and comparable state statutes. The EPA and various state agencies have limited the disposal options for certain wastes, including wastes designated as hazardous under RCRA and state analogs (Hazardous Wastes). Furthermore, although oil and gas wastes generally are exempt from regulation as hazardous waste, not all current comparable state statutes may provide this exemption, and certain wastes generated by the Company may be subject to RCRA or comparable state statutes. It is possible that certain wastes generated by the Companys oil and gas operations that are currently exempt may in the future be designated as Hazardous Wastes under RCRA or other applicable statutes and, therefore, may be subject to more rigorous and costly disposal requirements.
Clean Water Act
The Clean Water Act (CWA) and analogous state laws impose restrictions and strict controls regarding the discharge (including spills and leaks) of pollutants, including produced waters and other oil and natural gas
13
Table of Contents
Index to Financial Statements
wastes, into state waters and waters of the United States, a term broadly defined. These controls have become more stringent over the years, and it is probable that additional restrictions will be imposed in the future. Generally, permits must be obtained to discharge pollutants. The CWA provides for civil, criminal and administrative penalties for unauthorized discharges of oil and hazardous substances and of other pollutants. It imposes substantial potential liability for the costs of removal or remediation associated with discharges of oil or other pollutants. The CWA also prohibits the discharge of fill materials to regulated waters, including wetlands, without a permit. State laws governing discharges to water also provide varying civil, criminal and administrative penalties and impose liabilities in the case of a discharge of petroleum or its derivatives, or other pollutants, into state waters. In addition, the EPA has promulgated regulations that may require the Company to obtain permits to discharge storm water runoff, including discharges associated with construction activities. In the event of an unauthorized discharge of wastes, the Company may be liable for penalties and cleanup and response costs.
Oil Pollution Act
The Oil Pollution Act of 1990 (OPA), which amends and augments oil spill provisions of the CWA, imposes certain duties and liabilities on certain responsible parties related to the prevention of oil spills and damages resulting from such spills in or threatening United States waters or adjoining shorelines. A liable responsible party includes the owner or operator of a facility, vessel or pipeline that is a source of an oil discharge or that poses the substantial threat of discharge, or in the case of offshore facilities, the lessee or permittee of the area in which a discharging facility is located. OPA assigns joint and several liability, without regard to fault, to each liable party for oil removal costs and a variety of public and private damages. Although defenses exist to the liability imposed by OPA, they are limited. In the event of an oil discharge or substantial threat of discharge, the Company may be liable for costs and damages.
The OPA also imposes ongoing requirements on a responsible party, including proof of financial responsibility to cover at least some costs in a potential spill. Certain amendments to the OPA that were enacted in 1996 require owners and operators of offshore facilities that have a worst case oil spill potential of more than 1,000 Bbls to demonstrate financial responsibility in amounts ranging from $10 million in specified state waters and $35 million in federal outer continental shelf (OCS) waters, with higher amounts, up to $150 million based upon worst case oil-spill discharge volume calculations. In light of recent events, it is possible that these requirements may become more stringent. The Company believes that currently it has established adequate proof of financial responsibility for its offshore facilities.
Safe Drinking Water Act and Hydraulic Fracturing
Hydraulic fracturing involves the injection of water, sand and chemicals under pressure into formations to fracture the surrounding rock and stimulate production. Hydraulic fracturing activities are typically regulated by state oil and gas commissions but not at the federal level, as the federal Safe Drinking Water Act expressly excludes regulation of these fracturing activities (except where diesel is a component of the fracturing fluid). Due to public concerns raised regarding potential impacts of hydraulic fracturing on groundwater quality, there have been recent developments at the federal and state levels that could result in regulation of hydraulic fracturing becoming more stringent and costly. The EPA has commenced a study of the potential environmental impacts of hydraulic fracturing activities and released a progress report in December 2012, with final results anticipated in 2014. In addition, in December 2011, the EPA published an unrelated draft report concluding that hydraulic fracturing caused groundwater pollution in a natural gas field in Wyoming; this study remains subject to review.
In addition, a committee of the U.S. House of Representatives conducted an investigation of hydraulic fracturing practices. Moreover, in past sessions legislation was introduced before Congress to provide for federal regulation of hydraulic fracturing by eliminating the current exemption in the Safe Drinking Water Act, and, further, to require disclosure of the chemicals used in the fracturing process. Also, some states have adopted, and other states are considering adopting, regulations that restrict hydraulic fracturing in certain circumstances or that
14
Table of Contents
Index to Financial Statements
require disclosure of the chemicals in the fracturing fluids. Additionally some states, localities and river basin conservancy districts have exercised or considered exercising their regulatory powers to limit, and in some cases place a moratorium on hydraulic fracturing. The Bureau of Land Management has proposed regulations on hydraulic fracturing activities on federal lands.
Further, the EPA has announced an initiative under the Toxic Substances Control Act (TSCA) to develop regulations governing the disclosure and evaluation of hydraulic fracturing chemicals.
If new laws or regulations imposing significant restrictions or conditions on hydraulic fracturing activities are adopted in areas where the Company conducts business, the Company could incur substantial compliance costs and such requirements could adversely delay or restrict its ability to conduct fracturing activities on its assets.
Hydraulic FracturingTexas
All of the acreage and undeveloped reserves within the Granite Wash formation are subject to hydraulic fracturing. The hydraulic fracturing process is integral to our overall drilling and completion costs in the Granite Wash formation and represents approximately 40% of the total drilling/completion costs per well.
The Company diligently reviews best practices and industry standards, and complies with all regulatory requirements in the protection of these potable water sources. Protective practices include, but are not limited to, setting multiple strings of protection pipe across the potable water sources and cementing these pipes from setting depth to surface, continuously monitoring the hydraulic fracturing process in real time, and disposing of all non-commercially produced fluids in certified disposal wells at depths below the potable water sources.
Based on current drilling techniques, a typical fracturing procedure for a well in the Granite Wash formation uses approximately 5.0 million gallons of fluid, 4.9 million gallons of which is fresh water, and approximately 0.1 million gallons-equivalent of sand. By volume, fresh water makes up nearly 98% of the total fracturing fluid. Less than 1% of the remaining fluid is comprised of chemicals that are found in household or consumer products.
In compliance with the law enacted in Texas in June 2011 and regulations adopted in December 2011, the Company will, for any wells permitted after February 1, 2012, disclose hydraulic fracturing data to the Ground Water Protection Council and the Interstate Oil and Gas Compact Commission chemical registry. This disclosure is required for each chemical ingredient that is subject to OSHAs hazard communication standard regarding Material Safety Data Sheets, as well as the total volume of water used in the hydraulic fracturing treatment. A copy of the completed form is required to be submitted to the Railroad Commission of Texas with the completion report for the well. Additionally, a list of all other chemical ingredients not required by the registry is to be provided to the Railroad Commission for disclosure on a publicly accessible website. The Company has not permitted any wells after the February 1, 2012 compliance date and thus has not submitted any disclosures pertaining to the 2011 law and regulations.
There have not been any incidents, citations or suits related to the Companys hydraulic fracturing activities involving environmental concerns.
Hydraulic FracturingMontana
All of our leased acreage in Montana is potentially a candidate for hydraulic fracturing. The hydraulic fracturing process is integral to our overall drilling and completion costs in the BakkenThree Forks formations and represents approximately 40% of the total drilling and completion cost per well.
The Company diligently reviews best practices and industry standards, and complies with all regulatory requirements in the protection of potable water sources. Protective practices include, but are not limited to,
15
Table of Contents
Index to Financial Statements
setting multiple strings of protection pipe across the potable water sources and cementing these pipes from setting depth to surface. Prior to each hydraulic fracturing job, the pipe that conveys the fracturing fluids downhole is pressure tested to above the highest anticipated pump pressure, safety valves are installed and set to automatically relieve any over pressure, and the fracturing process is continuously real-time monitored to identify any anomaly. All non-commercial produced fluids are collected for disposal in certified injection wells at depths below the potable water sources.
Based on current drilling techniques, a typical fracturing procedure for a well in the BakkenThree Forks formation uses approximately 5.0 million gallons of fluid, 4.9 million gallons of which is fresh water, and approximately 0.1 million gallons-equivalent of sand. Fresh water makes up nearly 98% by volume of the total fracturing fluid. Less than 1% of the remaining fluid is comprised of chemicals that are found in household or consumer products.
In compliance with the Montana Dept. of Natural Resources and Conservation rules that went into effect on August 26, 2011, the Company has and will disclose hydraulic fracturing data to the Montana Board of Oil & Gas and on FracFocus, a voluntary, publicly accessible, disclosure web site maintained by the Ground Water Protection Council and the Interstate Oil and Gas Conservation Commission. This disclosure is required for each chemical ingredient that is subject to OSHAs hazard communication standard regarding Material Safety Data Sheets. Each component is listed along with the supplier, its trade name, purpose, ingredients, and maximum ingredient concentration. Details of each fracturing operation, including volumes, rates, and pressures, are provided to the Montana Board of Oil & Gas.
There have been no incidents, citations or suits related to the Companys hydraulic fracturing activities involving environmental concerns.
National Environmental Policy Act
Oil and natural gas exploration and production activities on federal lands may be subject to the National Environmental Policy Act, or NEPA, which requires federal agencies, including the Department of Interior, to evaluate major agency actions having the potential to significantly impact the environment. In the course of such evaluations, an agency will prepare an Environmental Assessment that assesses the potential direct, indirect and cumulative impacts of a proposed project and, if necessary, will prepare a more detailed Environmental Impact Statement that may be made available for public review and comment. To the extent that our current exploration and production activities, as well as proposed exploration and development plans, on federal lands require governmental permits that are subject to the requirements of NEPA, this process has the potential to delay or impose additional conditions upon the development of oil and natural gas projects.
Endangered Species Act
The Endangered Species Act (ESA) was established to protect endangered and threatened species. Pursuant to that act, if a species is listed as threatened or endangered, restrictions may be imposed on activities adversely affecting that species habitat. Similar protections are offered to migratory birds under the Migratory Bird Treaty Act. The U.S. Fish and Wildlife Service must also designate the species critical habitat and suitable habitat as part of the effort to ensure survival of the species. A critical habitat or suitable habitat designation could result in further material restrictions to land use and may materially delay or prohibit land access for oil and natural gas development. If the Company were to have a portion of its leases designated as critical or suitable habitat, it may adversely impact the value of the affected leases.
Climate Change Legislation
More stringent laws and regulations relating to climate change and greenhouse gases (GHGs) may be adopted in the future and could cause us to incur material expenses in complying with them. The EPA has adopted rules under the Clean Air Act (CAA) for the permitting of GHG emissions from stationary sources
16
Table of Contents
Index to Financial Statements
under the Prevention of Significant Deterioration (PSD) and Title V permitting programs. The EPA has adopted a multi-tiered approach to this permitting, with the largest sources first subject to permitting. In addition, both houses of the United States Congress have considered legislation to reduce emissions of greenhouse gases without any ultimate resolution and many states have taken or considered legal measures to reduce GHG emissions, including, in a few locations, the consideration of a cap and trade program. Most cap and trade programs work by requiring major sources of emissions or major producers of fuels to acquire and surrender emission allowances. Depending on the regulatory reach of the EPAs rules or new CAA legislation or implementing regulations restricting the emission of GHGs or state programs, the Company could incur significant costs to control its emissions and comply with regulatory requirements. In addition, in October 2009, the EPA adopted a mandatory GHG emissions reporting program which imposes reporting and monitoring requirements on various industries and in November 2010, expanded this GHG reporting rule to include onshore and offshore oil and natural gas production facilities and onshore oil and natural gas processing, transmission, storage and distribution facilities. The Company will incur costs to monitor, keep records of, and report emissions of GHGs. We do not believe that our compliance with applicable monitoring, recordkeeping and reporting requirements under the reporting rule as recently amended will have a material adverse effect on our results of operations or financial position.
Because of the lack of any comprehensive legislative program addressing GHGs, there is a great deal of uncertainty as to how federal and state regulation of GHGs will unfold and how it may impact our industry. Moreover, the federal, regional, state and local regulatory initiatives could adversely affect the marketability of the oil and natural gas that the Company produces. The impact of such future programs cannot be predicted, but the Company does not expect its operations to be affected any differently than other similarly situated domestic competitors.
Air Emissions
The Companys operations are subject to local, state and federal regulations for the control of emissions from sources of air pollution. At the Federal level, the Clean Air Act is the primary statute governing air pollution. Federal and state laws require new and modified sources of air pollutants to obtain permits prior to commencing construction. Major sources of air pollutants are subject to more stringent, federally imposed requirements including additional permits. Federal and state laws designed to control hazardous (or toxic) air pollutants might require installation of additional controls. Administrative enforcement actions for failure to comply with air pollution regulations or permits are generally resolved by payment of monetary fines and correction of any identified deficiencies. Alternatively, regulatory agencies could bring lawsuits for civil penalties or require the Company to forego construction, modification or operation of certain air emission sources.
On April 17, 2012, the EPA issued final rules to subject oil and gas operations to regulation under the New Source Performance Standards, or NSPS, and National Emission Standards for Hazardous Air Pollutants, or NESHAPS, programs under the CAA, and to impose new and amended requirements under both programs. The EPA rules include NSPS standards for completions of hydraulically fractured natural gas wells. Before January 1, 2015, these standards require owners/operators to reduce VOC emissions from natural gas not sent to the gathering line during well completion either by flaring using a completion combustion device or by capturing the natural gas using green completions with a completion combustion device. Beginning January 1, 2015, operators must capture the natural gas and make it available for use or sale, which can be done through the use of green completions. The standards are applicable to new hydraulically fractured wells and also existing wells that are refractured. Further, the finalized regulations also establish specific new requirements, effective in 2012, for emissions from compressors, controllers, dehydrators, storage tanks, natural gas processing plants and certain other equipment. These rules may require changes to our operations, including the installation of new equipment to control emissions. We are currently evaluating the effect these rules will have on our business.
17
Table of Contents
Index to Financial Statements
Coastal Coordination
There are various federal and state programs that regulate the conservation and development of coastal resources. The federal Coastal Zone Management Act (CZMA) was passed in 1972 to preserve and, where possible, restore the natural resources of the Nations coastal zone. The CZMA provides for federal grants for state management programs that regulate land use, water use and coastal development.
In Texas, the Legislature enacted the Coastal Coordination Act (CCA), which provides for the coordination among local and state authorities to protect coastal resources through regulating land use, water, and coastal development. The act establishes the Texas Coastal Management Program (CMP). The CMP is limited to the nineteen counties that border the Gulf of Mexico and its tidal bays. The CCA provides for the review of state and federal agency rules and agency actions for consistency with the goals and policies of the Coastal Management Plan. This review may impact agency permitting and review activities and add an additional layer of review to certain activities undertaken by the Company.
OSHA and Other Regulations
To the extent not preempted by other applicable laws, the Company is subject to the requirements of the federal Occupational Safety and Health Act (OSHA) and comparable state statutes, where applicable. The OSHA hazard communication standard, the EPA community right-to-know regulations under Title III of CERCLA and similar state statutes, where applicable, require the Company to organize, maintain and/or disclose information about hazardous materials used or produced in its operations.
FORWARD-LOOKING STATEMENTS
This report includes forward-looking statements within the meaning of Section 27A of the Securities Act of 1933, as amended, and Section 21E of the Securities Exchange Act of 1934, as amended, which are intended to be covered by the safe harbors created by those laws. The Company has based these forward-looking statements on its current expectations and projections about future events. These forward-looking statements include information about possible or assumed future results of the Companys operations. All statements, other than statements of historical facts, included in this report that address activities, events or developments that the Company expects or anticipates may occur in the future, including without limitation, statements regarding the Companys financial position, operating performance and results, reserve quantities and net present values, market prices, business strategy, derivative activities, the amount and nature of capital expenditures, plans and objectives of the Companys management for future operations are forward-looking statements. When the Company uses words such as anticipate, believe, estimate, expect, intend, forecast, outlook, aim, will, could, should, may, likely, plan, probably or similar expressions, the Company is making forward-looking statements. Many risks and uncertainties that could affect the Companys future results and could cause results to differ materially from those expressed in the Companys forward-looking statements include, but are not limited to:
| | the volatility of oil and natural gas prices; |
| | the uncertainty of estimates of oil and natural gas reserves; |
| | the impact of competition; |
| | the availability and cost of seismic, drilling and other equipment; |
| | operating hazards inherent in the exploration for and production of oil and natural gas; |
| | difficulties encountered during the exploration for and production of oil and natural gas; |
| | difficulties encountered in measuring and delivering oil to commercial markets; |
| | discovery, acquisition, development and replacement of oil and gas reserves; |
| | timing and amount of future production of oil and gas; |
18
Table of Contents
Index to Financial Statements
| | hedging decisions, including whether or not to enter into derivative financial instruments; |
| | our ability to effectively integrate companies and properties that we acquire; |
| | general economic conditions, including any future economic downturn, disruption in financial markets and the availability of credit; |
| | changes in customer demand and producers supply; |
| | future capital requirements and the Companys ability to attract capital; |
| | currency exchange rates; |
| | actions by the governments and events occurring in the countries in which we operate; |
| | actions by our venture partners; |
| | compliance with, or the effect of changes in, governmental regulations regarding the Companys exploration and production, including those related to climate change; |
| | actions of operators of the Companys oil and gas properties; and |
| | weather conditions. |
The information contained in this report, including the information set forth under the heading Risk Factors, identifies additional factors that could cause the Companys results or performance to differ materially from those the Company expresses in its forward-looking statements. Although the Company believes that the assumptions underlying its forward-looking statements are reasonable, any of these assumptions and therefore also the forward-looking statements based on these assumptions, could themselves prove to be inaccurate. In light of the significant uncertainties inherent in the forward-looking statements which are included in this report, the Companys inclusion of this information is not a representation by the Company or any other person that the Companys objectives and plans will be achieved. When you consider the Companys forward-looking statements, you should keep in mind these risk factors and the other cautionary statements in this report.
The Companys forward-looking statements speak only as of the date made and the Company will not update these forward-looking statements unless the securities laws require the Company to do so. The Companys forward-looking statements are expressly qualified in their entirety by this cautionary statement. In light of these risks, uncertainties and assumptions, any forward-looking events discussed in this report may not occur.
| Item 1A. | Risk Factors |
You should carefully consider the following risk factors in addition to the other information included in this report. If any of these risks or uncertainties actually occurs, our business, financial condition and results of operations could be materially adversely affected. Additional risks not presently known to us or which we consider immaterial based on information currently available to us may also materially adversely affect us. In this section, the terms VAALCO, we, us and our refer to VAALCO Energy, Inc. and its subsidiaries, unless the context clearly indicates otherwise.
Almost all of the value of our production and reserves is concentrated in a single block offshore Gabon, and any production problems or reductions in reserve estimates related to this property would adversely impact our business.
The Etame field consisting of five producing wells, the Avouma and South Tchibala fields consisting of one well and two wells, respectively, and the Ebouri field with one producing well constituted approximately 95% of our total production for the year ended December 31, 2012. In addition, at December 31, 2012, 96% of our total net proved reserves were attributable to these fields. If mechanical problems, storms or other events curtailed a
19
Table of Contents
Index to Financial Statements
substantial portion of this production, or if the actual reserves associated with this producing property are less than our estimated reserves, our results of operations, financial condition, and cash flows could be materially adversely affected.
Our results of operations, financial condition, and cash flows could be adversely affected by changes in currency exchange rates.
Our results of operations, financial condition, and cash flows are affected by currency exchange rates. While oil sales are denominated in U.S. dollars, portions of our operating costs in Gabon are denominated in the local currency. A weakening U.S. dollar will have the effect of increasing operating costs while a strengthening U.S. dollar will have the effect of reducing operating costs. The Gabon local currency is tied to the Euro. The exchange rate between the Euro and the U.S. dollar has fluctuated widely in recent years in response to international political conditions, general economic conditions, the European sovereign debt crisis and other factors beyond our control.
A decrease in oil and gas prices may adversely affect our results of operations, financial condition, and cash flows.
Our revenues, cash flow, profitability and future rate of growth are substantially dependent upon prevailing prices for oil and gas. Our ability to borrow funds and to obtain additional capital on attractive terms is also substantially dependent on oil and gas prices. Historically, world-wide oil and gas prices and markets have been volatile, and may continue to be volatile in the future. The average price for crude we sold in 2012 was $111.09 per barrel compared to $111.92 per barrel in 2011, and $78.39 per barrel in 2010.
Prices for oil and gas are subject to wide fluctuations in response to relatively minor changes in the supply of and demand for oil and gas, market uncertainty and a variety of additional factors that are beyond our control. These factors include international political conditions, including recent uprisings and political unrest in the Middle East and Africa, the European sovereign debt crisis, the domestic and foreign supply of oil and gas, the level of consumer demand, weather conditions, domestic and foreign governmental regulations, the price and availability of alternative fuels, the health of international economic and credit markets, and general economic conditions. In addition, various factors, including the effect of federal, state and foreign regulation of production and transportation, general economic conditions, changes in supply due to drilling by other producers and changes in demand may adversely affect our ability to market our oil and gas production. Any significant decline in the price of oil or gas would adversely affect our revenues, operating income, cash flows and borrowing capacity and may require a reduction in the carrying value of our oil and gas properties and our planned level of capital expenditures.
If there is a sustained economic downturn or recession in the United States or globally, oil and gas prices may fall and may become and remain depressed for a long period of time, which may adversely affect our results of operations.
In recent years, we experienced an economic downturn or a recession in the United States and globally. The reduced economic activity associated with the economic downturn or recession may reduce the demand for, and the prices we receive for, our oil and gas production. A sustained reduction in the prices we receive for our oil and gas production will have a material adverse effect on our results of operations.
Unless we are able to replace reserves which we have produced, our cash flows and production will decrease over time.
Our future success depends upon our ability to find, develop or acquire additional oil and gas reserves that are economically recoverable. Except to the extent that we conduct successful exploration or development activities or acquire properties containing proved reserves, our estimated net proved reserves will generally
20
Table of Contents
Index to Financial Statements
decline as reserves are produced. There can be no assurance that our planned development and exploration projects and acquisition activities will result in significant additional reserves or that we will have continuing success drilling productive wells at economic finding costs. The drilling of oil and gas wells involves a high degree of risk, especially the risk of dry holes or of wells that are not sufficiently productive to provide an economic return on the capital expended to drill the wells. In addition, our drilling operations may be curtailed, delayed or canceled as a result of numerous factors, including title problems, weather conditions, political instability, availability of capital, economic/currency imbalances, compliance with governmental requirements, receipt of additional seismic data or the reprocessing of existing data, material changes in oil or gas prices, prolonged periods of historically low oil and gas prices, failure of wells drilled in similar formations or delays in the delivery of equipment and availability of drilling rigs. Certain domestic oil and gas producing properties are operated by third parties and, as a result, we have limited control over the nature and timing of exploration and development of such properties or the manner in which operations are conducted on such properties.
Substantial capital, which may not be available to us in the future, is required to replace and grow reserves.
We make, and will continue to make, substantial capital expenditures for the acquisition, exploitation, development, exploration and production of oil and gas reserves. Historically, we have financed these expenditures primarily with cash flow from operations, debt, asset sales, and private sales of equity. During 2012, we participated, and in 2013 we expect to continue to participate, in the further exploration and development projects on our international properties. In Gabon and Angola, we are the operator of the blocks and are thus responsible for contracting on behalf of all the remaining parties participating in the project. We rely on the timely payment of cash calls by our partners to pay for the 69.65% share of the Etame budget. Assuming a replacement partner is obtained and at the same working interest as the former partner, we will rely on the timely payment of cash calls by such partner to pay for the 50% share of the Angola Block 5 expenditures. Beginning in late 2013, we expect to incur substantial capital expenditures as a non-operator with a 31% working interest in Block P, Equatorial Guinea.
However, if lower oil and gas prices, operating difficulties or declines in reserves result in our revenues being less than expected or limit our ability to borrow funds, or our partners fail to pay their share of project costs, we may have a limited ability, particularly in the current economic environment, to expend the capital necessary to undertake or complete future drilling programs. We cannot assure you that additional debt or equity financing or cash generated by operations will be available to meet these requirements.
Our drilling activities require us to risk significant amounts of capital that may not be recovered.
Drilling activities are subject to many risks, including the risk that no commercially productive reservoirs will be encountered. There can be no assurance that new wells drilled by us will be productive or that we will recover all or any portion of our investment. Drilling for oil and gas may involve unprofitable efforts, not only from dry wells, but also from wells that are productive but do not produce sufficient net revenues to return a profit after drilling, operating and other costs. The cost of drilling, completing and operating wells is often uncertain and cost overruns are common. Our drilling operations may be curtailed, delayed or canceled as a result of numerous factors, many of which are beyond our control, including title problems, weather conditions, compliance with governmental requirements and shortages or delays in the delivery of equipment and services.
As part of our exploration and development operations, we have expanded, and expect to further expand, the application of horizontal drilling and multi-stage hydraulic fracture stimulation techniques. The utilization of these techniques requires substantially greater capital expenditures as compared to the drilling of a vertical well. The incremental capital expenditures are largely the result of additional hydraulic fracture stages in horizontal wellbores.
21
Table of Contents
Index to Financial Statements
Weather, unexpected subsurface conditions and other unforeseen operating hazards may adversely impact our oil and gas activities.
The oil and gas business involves a variety of operating risks, including fire, explosions, blow-outs, pipe failure, casing collapse, abnormally pressured formations and environmental hazards such as oil spills, gas leaks, ruptures and discharges of toxic gases, underground migration and surface spills or mishandling of fracture fluids including chemical additives, the occurrence of any of which could result in substantial losses to us due to injury and loss of life, severe damage to and destruction of property, natural resources and equipment, pollution and other environmental damage, clean-up responsibilities, regulatory investigation and penalties and suspension of operations. Our production facilities are also subject to hazards inherent in marine operations, such as capsizing, sinking, grounding, collision and damage from severe weather conditions. The relatively deep offshore drilling conducted by us overseas involves increased drilling risks of high pressures and mechanical difficulties, including stuck pipe, collapsed casing and separated cable. The impact that any of these risks may have upon us is increased due to the low number of producing properties we own.
We maintain insurance against some, but not all, potential risks; however, there can be no assurance that such insurance will be adequate to cover any losses or exposure for liability. The occurrence of a significant unfavorable event not fully covered by insurance could have a material adverse effect on our financial condition, results of operations and cash flows. Furthermore, we cannot predict whether insurance will continue to be available at a reasonable cost or at all.
Our reserve information represents estimates that may turn out to be incorrect if the assumptions upon which these estimates are based are inaccurate. Any material inaccuracies in these reserve estimates or underlying assumptions will materially affect the quantities and present values of our reserves.
There are numerous uncertainties inherent in estimating quantities of proved oil and gas reserves, including many factors beyond our control. Reserve engineering is a subjective process of estimating the underground accumulations of oil and gas that cannot be measured in an exact manner. The estimates included in this document are based on various assumptions required by the SEC, including unescalated prices and costs and capital expenditures subsequent to December 31, 2012, and, therefore, are inherently imprecise indications of future net revenues. Actual future production, revenues, taxes, operating expenses, development expenditures and quantities of recoverable oil and gas reserves may vary substantially from those assumed in the estimates. Any significant variance in these assumptions could materially affect the estimated quantity and value of reserves incorporated by reference in this document. In addition, our reserves may be subject to downward or upward revision based upon production history, results of future development, availability of funds to acquire additional reserves, prevailing oil and gas prices and other factors. Moreover, the calculation of the estimated present value of the future net revenue using a 10% discount rate as required by the SEC is not necessarily the most appropriate discount factor based on interest rates in effect from time to time and risks associated with our reserves or the oil and gas industry in general. It is also possible that reserve engineers may make different estimates of reserves and future net revenues based on the same available data.
The estimated future net revenues attributable to our net proved reserves are prepared in accordance with current SEC guidelines, and are not intended to reflect the fair market value of our reserves. In accordance with the rules of the SEC, our reserve estimates are prepared using an average of beginning of month prices received for oil and gas for the preceding twelve months. Future reductions in prices below the average calculated for 2012 would result in the estimated quantities and present values of our reserves being reduced.
A substantial portion of our proved reserves are or will be subject to service contracts, production sharing contracts and other arrangements. The quantity of oil and gas that we will ultimately receive under these arrangements will differ based on numerous factors, including the price of oil and gas, production rates, production costs, cost recovery provisions and local tax and royalty regimes. Changes in many of these factors do not affect estimates of U.S. reserves in the same way they affect estimates of proved reserves in foreign
22
Table of Contents
Index to Financial Statements
jurisdictions, or will have a different effect on reserves in foreign countries than in the United States. As a result, proved reserves in foreign jurisdictions may not be comparable to proved reserve estimates in the United States.
We have less control over our foreign investments than domestic investments, and turmoil in foreign countries may affect our foreign investments.
Our international assets and operations are subject to various political, economic and other uncertainties, including, among other things, the risks of war, expropriation, nationalization, renegotiation or nullification of existing contracts, taxation policies, foreign exchange restrictions, changing political conditions, international monetary fluctuations, currency controls and foreign governmental regulations that favor or require the awarding of drilling contracts to local contractors or require foreign contractors to employ citizens of, or purchase supplies from, a particular jurisdiction. In addition, if a dispute arises with foreign operations, we may be subject to the exclusive jurisdiction of foreign courts or may not be successful in subjecting foreign persons, especially foreign oil ministries and national oil companies, to the jurisdiction of the United States.
Private ownership of oil and gas reserves under oil and gas leases in the United States differs distinctly from our ownership of foreign oil and gas properties. In the foreign countries in which we do business, the state generally retains ownership of the minerals and consequently retains control of, and in many cases participates in, the exploration and production of hydrocarbon reserves. Accordingly, operations outside the United States may be materially affected by host governments through royalty payments, export taxes and regulations, surcharges, value added taxes, production bonuses and other charges.
Almost all of our proven reserves are located offshore of the Republic of Gabon. As of December 31, 2012, we carried an investment, before depletion and amortization, of approximately $198.5 million including leasehold and asset retirement obligations on our balance sheet associated with the Etame Marin block. We have operated in Gabon since 1995 and believe we have good relations with the current Gabonese government. However, there can be no assurance that present or future administrations or governmental regulations in Gabon will not materially adversely affect our operations or cash flows.
Another time extension for the drilling of two exploration wells in Angola may be necessary to prevent the loss of our investment in that country.
Due to financial non-performance of the venture partner assigned by the government of Angola, our plans to drill the two obligatory wells have been delayed. A government decree effective December 1, 2010 removed the former partner from the production sharing agreement and provided us with a one year extension through the end of November 2011, which has subsequently been extended through the end of November 2014. We continue to work with the government of Angola to secure a replacement partner. After a new partner is obtained, another time extension may be required if reasonable time to drill the two commitment wells does not exist. We can give no assurances that another time extension, if necessary, will be granted. If the government of Angola were to deny a further time extension, the Company may be required to impair its leasehold costs and other investments with a carrying value of $11.0 million as of December 31, 2012. The Company may also have to make a $10.0 million payment for failing to drill the two exploration commitment wells.
Competitive industry conditions may negatively affect our ability to conduct operations.
We operate in the highly competitive areas of oil exploration, development and production. We compete with, and may be outbid by, competitors in our attempts to acquire exploration and production rights in oil and gas properties. These properties include exploration prospects as well as properties with proved reserves. There is also competition for contracting for drilling equipment and the hiring of experienced personnel. Factors that affect our ability to compete in the marketplace include:
| | our access to the capital necessary to drill wells and acquire properties; |
| | our ability to acquire and analyze seismic, geological and other information relating to a property; |
23
Table of Contents
Index to Financial Statements
| | our ability to retain and hire the personnel necessary to properly evaluate seismic and other information relating to a property; |
| | our ability to hire experienced personnel, especially for our accounting, financial reporting, tax and land departments; |
| | the location of, and our ability to access, platforms, pipelines and other facilities used to produce and transport oil and gas production; and |
| | the standards we establish for the minimum projected return on an investment of our capital. |
Our competitors include major integrated oil companies and substantial independent energy companies, many of which possess greater financial, technological, personnel and other resources than we do. These companies may be able to pay more for oil and natural gas properties, evaluate, bid for and purchase a greater number of properties than our financial or human resources permit, and be better able than we are to continue drilling during periods of low oil and gas prices, to contract for drilling equipment and to secure trained personnel. Our competitors may also use superior technology which we may be unable to afford or which would require costly investment by us in order to compete.
The distressed financial conditions of customers could have an adverse impact on us in the event these customers are unable to pay us for the products or services we provide.
Some of our customers may experience, in the future, severe financial problems that have had or may have a significant impact on their creditworthiness. We cannot provide assurance that one or more of our financially distressed customers will not default on their obligations to us or that such a default or defaults will not have a material adverse effect on our business, financial position, future results of operations or future cash flows. Furthermore, the bankruptcy of one or more of our customers, or some other similar proceeding or liquidity constraint, might make it unlikely that we would be able to collect all or a significant portion of amounts owed by the distressed entity or entities. In addition, such events might force such customers to reduce or curtail their future use of our products and services, which could have a material adverse effect on our results of operations and financial condition.
We may be unable to integrate successfully the operations of any acquisitions with our operations and we may not realize all the anticipated benefits of the recent acquisitions or any future acquisition.
Failure to successfully assimilate any acquisitions could adversely affect our financial condition and results of operations.
Acquisitions involve numerous risks, including:
| | operating a significantly larger combined organization and adding operations; |
| | difficulties in the assimilation of the assets and operations of the acquired business, especially if the assets acquired are in a new business segment or geographic area; |
| | the risk that oil and natural gas reserves acquired may not be of the anticipated magnitude or may not be developed as anticipated; |
| | the loss of significant key employees from the acquired business; |
| | the diversion of managements attention from other business concerns; |
| | the failure to realize expected profitability or growth; |
| | the failure to realize expected synergies and cost savings; |
| | coordinating geographically disparate organizations, systems and facilities; and |
| | coordinating or consolidating corporate and administrative functions. |
24
Table of Contents
Index to Financial Statements
Further, unexpected costs and challenges may arise whenever businesses with different operations or management are combined, and we may experience unanticipated delays in realizing the benefits of an acquisition. If we consummate any future acquisition, our capitalization and results of operation may change significantly, and you may not have the opportunity to evaluate the economic, financial and other relevant information that we will consider in evaluating future acquisitions.
Properties that we buy may not produce as projected and we may be unable to determine reserve potential, identify liabilities associated with the properties or obtain protection from sellers against such liabilities, which could result in material liabilities and adversely affect our financial condition.
One of our growth strategies is to capitalize on opportunistic acquisitions of oil and gas reserves. Any future acquisition will require an assessment of recoverable reserves, title, future oil and gas prices, operating costs, potential environmental hazards, potential tax and ERISA liabilities, and other liabilities and similar factors. Ordinarily, our review efforts are focused on the higher valued properties and are inherently incomplete because it generally is not feasible to review in depth every individual property involved in each acquisition. Even a detailed review of records and properties may not necessarily reveal existing or potential problems, nor will it permit a buyer to become sufficiently familiar with the properties to assess fully their deficiencies and potential. Inspections may not always be performed on every well, and potential problems, such as ground water contamination and other environmental conditions and deficiencies in the mechanical integrity of equipment are not necessarily observable even when an inspection is undertaken. Any unidentified problems could result in material liabilities and costs that negatively impact our financial condition.
Additional potential risks related to acquisitions include, among other things:
| | incorrect assumptions regarding the future prices of oil and gas or the future operating or development costs of properties acquired; |
| | incorrect estimates of the oil and gas reserves attributable to a property we acquire; |
| | an inability to integrate successfully the businesses we acquire; |
| | the assumption of liabilities; |
| | limitations on rights to indemnity from the seller; |
| | the diversion of managements attention from other business concerns; and |
| | losses of key employees at the acquired businesses. |
If we consummate any future acquisitions, our capitalization and results of operations may change significantly.
Compliance with environmental and other government regulations could be costly and could negatively impact production.
The laws and regulations of the United States, Gabon, Angola, Equatorial Guinea and Great Britain regulate our current business. Our operations could result in liability for personal injuries, property damage, natural resource damages, oil spills, discharge of hazardous materials, remediation and clean-up costs and other environmental damages. Failure to comply with environmental laws and regulations may trigger a variety of administrative, civil and criminal enforcement measures, including the assessment of monetary penalties and the issuance of orders enjoining operations. In addition, we could be liable for environmental damages caused by, among others, previous property owners or operators. We could also be affected by more stringent laws and regulations adopted in the future, including any related to climate change and greenhouse gases and use of fracking fluids, resulting in increased operating costs. As a result, substantial liabilities to third parties or governmental entities may be incurred, the payment of which could have a material adverse effect on our financial condition, results of operations and liquidity. Additionally, more stringent GHG regulation could impact demand for oil and gas.
25
Table of Contents
Index to Financial Statements
These laws and governmental regulations, which cover matters including drilling operations, taxation and environmental protection, may be changed from time to time in response to economic or political conditions and could have a significant impact on our operating costs, as well as the oil and gas industry in general. While we believe that we are currently in compliance with environmental laws and regulations applicable to our operations, no assurances can be given that we will be able to continue to comply with such environmental laws and regulations without incurring substantial costs.
Significant physical effects of climatic change have the potential to damage our facilities, disrupt our production activities and cause us to incur significant costs in preparing for or responding to those effects.
In an interpretative guidance on climate change disclosures, the SEC indicates that climate change could have an effect on the severity of weather (including hurricanes and floods), sea levels, the arability of farmland, and water availability and quality. If such effects were to occur, our exploration and production operations have the potential to be adversely affected. Potential adverse effects could include damages to our facilities from powerful winds or rising waters in low-lying areas, disruption of our production activities either because of climate-related damages to our facilities in our costs of operation potentially arising from such climatic effects, less efficient or non-routine operating practices necessitated by climate effects or increased costs for insurance coverages in the aftermath of such effects. Significant physical effects of climate change could also have an indirect affect on our financing and operations by disrupting the transportation or process-related services provided by midstream companies, service companies or suppliers with whom we have a business relationship. We may not be able to recover through insurance some or any of the damages, losses or costs that may result from potential physical effects of climate change. In addition, our hydraulic fracturing operations require large amounts of water. Should climate change or other drought conditions occur, our ability to obtain water in sufficient quality and quantity could be impacted and in turn, our ability to perform hydraulic fracturing operations could be restricted or made more costly.
Our sales of oil and natural gas are affected by the availability, terms and cost of pipeline transportation.
The price and terms for access to pipeline transportation remain subject to extensive federal and state regulation. If these regulations change, or if rate increase requests are approved, we could face higher transmission costs for our production and, possibly, reduced access to transmission capacity.
Various proposals and proceedings that might affect the petroleum industry are pending before Congress, the Federal Energy Regulatory Commission, or FERC, various state legislatures, and the courts. The industry historically has been heavily regulated and we can offer you no assurance that the less stringent regulatory approach recently pursued by the FERC and Congress will continue nor can we predict what effect such proposals or proceedings may have on our operations.
If our assumptions underlying accruals for abandonment costs are too low, we could be required to expend greater amounts than expected.
Almost all of our producing properties are located offshore. The costs to abandon offshore wells may be substantial. For financial accounting purposes, we record the fair value of a liability for an asset retirement obligation in the period in which it is incurred by capitalizing it as part of the carrying amount of the long-lived assets. No assurances can be given that such reserves will be sufficient to cover such costs in the future as they are incurred.
As part of securing the second ten year production license with the government of Gabon, the Company agreed in principle to a cash funding arrangement for the eventual abandonment of the offshore wells, platforms and facilities. The agreement is not yet finalized, but calls for annual funding for the next seven years at 12.14% of the abandonment estimate and 5.0% for the last three years of the production license. The amounts paid will
26
Table of Contents
Index to Financial Statements
be reimbursed through the cost account and are non-refundable to the Company. The funding is expected to begin in 2013 after the agreement is finalized. The abandonment estimate for this purpose is estimated to be approximately $9.7 million net to the Company on an undiscounted basis. As in prior periods, the obligation for abandonment of the Gabon offshore facilities is included in the asset retirement obligation shown on the Companys balance sheet.
From time to time we may hedge a portion of our production, which may result in our making cash payments or prevent us from receiving the full benefit of increases in prices for oil and gas.
We may reduce our exposure to the volatility of oil and gas prices by hedging a portion of our production. Hedging also prevents us from receiving the full advantage of increases in oil or gas prices above the maximum fixed amount specified in the hedge agreement. Conversely, hedging may limit our ability to realize cash flows from commodity price increases. In a typical hedge transaction, we have the right to receive from the hedge counterparty the excess of the maximum fixed price specified in the hedge agreement over a floating price based on a market index, multiplied by the quantity hedged. If the floating price exceeds the maximum fixed price, we must pay the counterparty this difference multiplied by the quantity hedged even if we had insufficient production to cover the quantities specified in the hedge agreement. Accordingly, if we have less production than we have hedged when the floating price exceeds the fixed price, we must make payments against which there are no offsetting sales of production. If these payments become too large, the remainder of our business may be adversely affected.
In addition, hedging agreements expose us to risk of financial loss if the counterparty to a hedging contract defaults on its contract obligations. This risk of counterparty performance is of particular concern given the disruptions that occurred in the financial markets that lead to sudden changes in a counterpartys liquidity and hence their ability to perform under the hedging contract.
The adoption of derivatives legislation by the U.S. Congress could have an adverse effect on the Companys ability to use derivative instruments to reduce the effect of commodity price, interest rate, and other risks associated with its business.
The Dodd-Frank Wall Street Reform and Consumer Protection Act (HR 4173), signed into law in 2010, establishes, among other provisions, federal oversight and regulation of the over-the-counter derivatives market and entities, such as the Company, that participate in that market. The new legislation required the Commodities Futures Trading Commission (CFTC) and the Securities and Exchange Commission (SEC) to promulgate rules and regulations implementing the new legislation within 360 days from the date of enactment. The Dodd-Frank Act originally required most regulations to be promulgated by no later than July 16, 2011, but the CFTC and the SEC have both issued temporary relief to extend this deadline; although the CFTC and the SEC have issued final regulations in certain areas, final rules in other areas and the scope of relevant definitions and/or exemptions still remain to be finalized. In its rulemaking under the new legislation, the CFTC has issued a final rule on position limits for certain futures and option contracts in the major energy markets and for swaps that are their economic equivalents; the CFTCs final rule was set aside by the U.S. District Court for the District of Columbia on September 28, 2012 and remanded to the CFTC to resolve ambiguity as to whether statutory requirements for such limits to be determined necessary and appropriate were satisfied. As a result, the rule has not yet taken effect, although the CFTC has indicated that it intends to appeal the courts decision and that it believes the Dodd-Frank Act requires it to impose position limits. Certain bona fide hedging transactions or positions are exempt from these position limits. While it is not possible at this time to predict when the CFTC will finalize certain other related rules and regulations, depending on our classification, the financial reform legislation may require us to comply with margin requirements and with certain clearing and trade-execution requirements in connection with our derivative activities. The financial reform legislation may also require the counterparties to derivative instruments to spin off some of their derivatives activities to separate entities, which may not be as creditworthy as the current counterparties. The new legislation and any new regulations could significantly increase the cost of derivative contracts (including through requirements to post collateral which could adversely
27
Table of Contents
Index to Financial Statements
affect our available liquidity), materially alter the terms of derivative contracts and reduce the availability of derivatives to protect against risks we encounter. Finally, the legislation was intended, in part, to reduce the volatility of oil and natural-gas prices, which some legislators attributed to speculative trading in derivatives and commodity instruments related to oil and natural gas. Our revenues could therefore be adversely affected if a consequence of the legislation and regulations is to lower commodity prices. Any of these consequences could have a material adverse effect on our ability to hedge risks and on our consolidated financial position, results of operations, or cash flows.
The SECs adoption of certain rules requiring disclosure of payments to foreign governments in connection with the commercial development of oil, natural gas, or minerals could negatively affect the Companys operations.
Section 1504 of the Dodd-Frank Act also required the SEC to issue rules requiring resource extraction issuers to include in an annual report information relating to any payment made by the issuer, a subsidiary of the issuer, or an entity under the control of the issuer, to a foreign government or the Federal Government for the purpose of the commercial development of oil, natural gas, or minerals. On August 22, 2012, the SEC issued final rules: Disclosure of Payments by Resource Extraction Issuers (Final Rules). As a result, beginning in 2014, we must provide information about the type and total amount of payments made for each project related to the commercial development of oil, natural gas, or minerals, and the type and total amount of payments made to each government. We are currently evaluating the provisions of the Final Rules to determine their impact on our business. Impacts could include, among others:
| | loss of our license to operate in other countries where the laws and regulations or terms of production sharing or other contracts prohibit disclosures of certain information, resulting in a reduction in our profitability; |
| | decrease in our ability to compete for new sources of reserves with state-controlled national oil companies or large multi-national companies not subject to disclosures under the Final Rules; and |
| | reduction in profitability and cash flows and a decrease in the price of our common stock. |
Certain U.S. federal income tax preferences currently available with respect to oil and natural gas production may be eliminated as a result of future legislation.
In recent years, the current U.S. governments budget proposals and other proposed legislation have included the elimination of certain key U.S. federal income tax incentives currently available to oil and gas exploration and production. If enacted into law, these proposals would eliminate certain tax preferences applicable to taxpayers engaged in the exploration or production of natural resources. These changes include, but are not limited to (i) the repeal of the percentage depletion allowance for oil and gas properties, (ii) the elimination of current deductions for intangible drilling and development costs, (iii) the elimination of the deduction for U.S. production activities and (iv) the increase in the amortization period from two years to seven years for geophysical costs paid or incurred in connection with the exploration for or development of, oil and gas within the United States. It is unclear whether any such changes will be enacted or how soon any such changes would become effective. The passage of any legislation as a result of these proposals or any other similar changes in U.S. federal income tax laws could negatively affect the Companys financial condition and results of operations.
We rely on our senior management team and the loss of a single member could adversely affect our operations.
We are highly dependent upon our executive officers and key employees. The unexpected loss of the services of any of these individuals could have a detrimental effect on us. We do not maintain key man life insurance on any of our employees.
28
Table of Contents
Index to Financial Statements
We rely on a single purchaser of our Gabon production, which could have a material adverse effect on our results of operations.
Effective January 2011, we sell all of our crude oil production in Gabon to Mercuria and the contract with Mercuria has been extended for calendar year 2013. The loss of Mercuria as a purchaser of our Gabon production could force the shut in of our Gabon production until the purchaser is replaced, and could have a material adverse effect on our results of operations.
The marketability of our production in Texas is dependent upon transportation and processing facilities over which we may have no control.
The marketability of our production from Texas depends in part upon the availability, proximity and capacity of pipelines, natural gas gathering systems and processing facilities. We deliver crude oil and natural gas produced from these areas through gathering systems and pipelines, some of which we do not own. The lack of availability of capacity on third-party systems and facilities could reduce the price offered for our production or result in the shut-in of producing wells or the delay or discontinuance of development plans for properties. Although we have some contractual control over the transportation of our production through firm transportation arrangements, third-party systems and facilities may be temporarily unavailable due to market conditions or mechanical or other reasons, including adverse weather conditions. Activist or other efforts may delay or halt the construction of additional pipelines or facilities.
Third-party systems and facilities may not be available to us in the future at a price that is acceptable to us. Any significant change in market factors or other conditions affecting these infrastructure systems and facilities, as well as any delays in constructing new infrastructure systems and facilities, could delay production, thereby harming our business and, in turn, our financial condition, results of operations and cash flows.
Federal legislation and state legislative and regulatory initiatives relating to hydraulic fracturing could result in increased costs and additional operating restrictions or delays.
Hydraulic fracturing is used to stimulate production of hydrocarbons, particularly natural gas, from tight formations. The process involves the injection of water, sand and chemicals under pressure into formations to fracture the surrounding rock and stimulate production. The process is typically regulated by state oil and gas commissions but is not subject to regulation at the federal level (except for fracturing activity involving the use of diesel). The EPA has commenced a study of the potential environmental impacts of hydraulic fracturing activities and released a progress report in 2012, with final results anticipated in 2014. In addition, in December 2011, the EPA published an unrelated draft report concluding that hydraulic fracturing caused groundwater pollution in a natural gas field in Wyoming; this study remains subject to review. A committee of the U.S. House of Representatives has conducted an investigation of hydraulic fracturing practices. In past sessions, legislation was introduced before Congress to provide for federal regulation of hydraulic fracturing and to require disclosure of the chemicals used in the fracturing process. In addition, some states and local jurisdictions have adopted, or are considering adopting, regulations that could restrict hydraulic fracturing in certain circumstances. For example, New York has imposed a de facto moratorium on the issuance of permits for high-volume, horizontal hydraulic fracturing until state-administered environmental studies are finalized. Further, Pennsylvania has adopted a variety of regulations limiting how and where fracturing can be performed. Any other new laws or regulations that significantly restrict hydraulic fracturing could make it more difficult or costly for us to perform hydraulic fracturing activities and thereby affect the determination of whether a well is commercially viable. Further, the EPA has announced an initiative under TSCA to develop regulations governing the disclosure and evaluation of hydraulic fracturing chemicals. If hydraulic fracturing is regulated at the federal level, our fracturing activities could become subject to additional permit requirements or operational restrictions and also to associated permitting delays and potential increases in costs. Such federal or state legislation could require the disclosure of chemical constituents used in the fracturing process to state or federal regulatory authorities who could then make such information publicly available. In addition, restrictions on hydraulic fracturing could reduce the amount of oil and natural gas that we are ultimately able to produce in commercial quantities.
29
Table of Contents
Index to Financial Statements
There are inherent limitations in all control systems, and misstatements due to error or fraud that could seriously harm our business may occur and not be detected.
Our management, including our Chief Executive Officer and Chief Financial Officer, do not expect that our internal controls and disclosure controls will prevent all possible error and all fraud. A control system, no matter how well conceived and operated, can provide only reasonable, not absolute, assurance that the objectives of the control system are met. In addition, the design of a control system must reflect the fact that there are resource constraints and the benefit of controls must be relative to their costs. Because of the inherent limitations in all control systems, an evaluation of controls can only provide reasonable assurance that all material control issues and instances of fraud, if any, in our Company have been detected. These inherent limitations include the realities that judgments in decision-making can be faulty and that breakdowns can occur because of simple error or mistake. Further, controls can be circumvented by the individual acts of some persons or by collusion of two or more persons. The design of any system of controls is based in part upon certain assumptions about the likelihood of future events, and there can be no assurance that any design will succeed in achieving its stated goals under all potential future conditions. Because of inherent limitations in a cost-effective control system, misstatements due to error or fraud may occur and not be detected. A failure of our controls and procedures to detect error or fraud could seriously harm our business and results of operations.
| Item 1B. | Unresolved Staff Comments |
None.
| Item 2. | Properties |
Offshore GabonEtame Marin Block
VAALCO has an interest in an approximately 759,000 gross acre offshore block in Gabon, the Etame Marin block, where it signed a production sharing contract in 1995. The block contains the Etame, Avouma, South Tchibala and Ebouri fields, all of which are in production, and the Southeast Etame and North Tchibala fields, which are currently being developed. These fields and discoveries consist of subsalt reservoirs that lie 20 miles offshore at a depth of approximately 250 feet.
VAALCO operates the Etame Marin block on behalf of a consortium of companies. At December 31, 2012, VAALCO owned a 30.35% interest in the exploration acreage within the Etame Marin block. The Company owns a 28.1% interest in the development areas in and surrounding the Etame, Avouma, South Tchibala and Ebouri fields. The development areas were subject to a 7.5% back-in by the Government of Gabon, which occurred for these fields after their successful development.
The Etame Marin block consortium approved the development of the Etame field in 2001. An application for commerciality was filed with the government of Gabon, and in July 2001 the consortium was awarded an approximately 12,000 gross acre exploitation area surrounding the field. The exploitation area has a term of 20 years (through 2021).
The Etame field has been developed at an aggregate cost of approximately $194.9 million ($52.9 million net to the Company). The development included drilling and completing subsea wells connected to a contracted floating production, storage and offloading vessel (FPSO). A successful development well was drilled in 2010 in this field. There are currently five wells producing in the Etame field.
In April 2005, a development plan for the joint development of the Avouma and South Tchibala fields was approved by the Gabon government. The Company was awarded an approximately 13,000 gross acre exploitation area which has a term of 20 years (until 2025). In 2006, the Company installed a platform in approximately 250 feet of water and drilled two development wells from the platform, one into each field. In 2010, a second development well in the South Tchibala field was drilled and successfully completed. The three development
30
Table of Contents
Index to Financial Statements
wells are tied back to the FPSO via a ten mile pipeline. Through December 31, 2012, the cost of developing the Avouma and South Tchibala fields was approximately $146.1 million ($43.2 million net to the Company).
The Company drilled the Ebouri discovery well to total depth in January 2004. In October 2006, the Gabon government approved the development plan for the Ebouri field and the Company was awarded an approximately 3,700 gross acre exploitation area which has a term of 20 years (until 2026). A platform was installed in July 2008, approximately seven miles from the FPSO and is tied back to the FPSO via a pipeline as was done for the Avouma and South Tchibala fields. The cost of developing the Ebouri field as of December 31, 2012 totaled approximately $190.4 million ($59.7 million net to the Company). The first development well began production in January 2009 and the second development well began producing crude oil in April 2009. A third development well began production in May 2010.
In July 2012, the Company discovered the presence of hydrogen sulfide (H2S) from two of the three producing wells in the Ebouri field. The wells were shut-in for safety reasons resulting in a decrease of approximately 2,000 BOPD or approximately 10% of the gross daily production from the Etame Marin block. Analysis and options for re-establishing production from the impacted area was undertaken in the second half of 2012. The expected outcome is that additional capital investment will be required, which is likely to include a new platform-type structure with H2S processing capability, and new wells to re-establish production from the impacted area. The design, cost projections and final investment decisions by the Company and its partners are expected to be made in 2013. Re-establishing production from the area impacted by H2S is expected in the first half of 2016.
The Company and its partners approved the construction of two additional production platforms in late 2012 as part of future development plans for the Etame Marin block. One platform will be located in the Etame field and the second platform will be located in-between the Southeast Etame and North Tchibala fields. Multiple wells are expected to be drilled from each of the platforms. The Company drilled a successful exploration well in the Southeast Etame area in 2010 which will be developed from the second platform. The expected cost to build and install the platforms in the 2013/2014 timeframe is $275.0 million ($77.0 million net to the Company). The cost of the wells is not included in the platform costs.
The Company has sold a total of 70.9 million gross Bbls (16.9 million net Bbls) from the fields within the Etame Marin block since startup in 2002 through December 31, 2012. During 2012, the Company sold approximately 7.0 million gross Bbls (1.7 million net Bbls) produced from the Etame, Avouma, South Tchibala and Ebouri fields.
The Company negotiated an extension of the exploration permit on this block to 2014. The terms of the extension include an additional exploration well, bringing the total required under the permit to two exploration wells, and to acquire additional 3-D seismic data, which was acquired in 2012. One of the two commitment exploration wells has been met with the drilling of the Omangou prospect, an unsuccessful effort, in 2010. The second exploration well is scheduled for drilling in mid-2013, which will satisfy the commitment.
Besides the exploration well, the drilling program that commenced in December 2012 includes a development well in the Avouma field, an exploration appraisal well to be drilled in the Ebouri field and three well recompletions to replace electrical submersible pumps.
Onshore GabonMutamba Iroru block
In November 2005, the Company signed a production sharing contract for the Mutamba Iroru block onshore Gabon. The five year contract awarded the Company exploration rights to approximately 270,000 acres along the central coast of Gabon. The Company acquired aeromagnetic gravity data in 2008, and together with seismic data acquired from previous operators over the block in 2006 and 2007, drilled two exploration wells in 2009. Both wells encountered water bearing sands and were abandoned.
31
Table of Contents
Index to Financial Statements
The Company executed a farm-out agreement in August 2010 with Total Gabon on the Mutamba Iroru block located onshore near the coast in central Gabon. The Mutamba Iroru block contains an exploration area of approximately 270,000 acres. Under the terms of the agreement, the Company and Total Gabon committed to reprocess 400 kilometers of 2-D seismic data and drill one exploration well. The seismic reprocessing work was completed in 2012. The exploration well was drilled in 2012 resulting in a discovery. A plan of development is expected to be completed for the NGongui field and submitted to the government of Gabon in 2013. In return for funding 75% of the work commitment (seismic reprocessing and exploration well costs), Total Gabon earned a 50% interest on the permit.
In 2010, the exploration permit was successfully extended until May 2012 and an application for a further nine-month extension was made in early 2012. In a letter agreement from the government of Gabon, the terms of the extension to March 2013 were agreed upon, yet the extension amendment was not executed by the government of Gabon. The Company and Total are working with the Gabon government in 2013 to finalize the extension and to obtain a further exploration extension. However, the Company can provide no assurances that such a request will be granted. The Company believes the discovery area is not impacted by the uncertainty of the extension agreement as the well was drilled during the contracted period and application of the discovery was timely made to the government of Gabon.
Offshore AngolaBlock 5
In November 2006, the Company signed a production sharing contract for Block 5 offshore Angola. The four year primary term with an optional three year extension awards the Company exploration rights to 1.4 million acres offshore central Angola. The Companys working interest is 40%. Additionally, the Company is required to carry the Angolan national oil company, Sonangol P&P, for 10% of the work program. During the first four years of the contract the Company was required to acquire and process 1,000 square kilometers of 3-D seismic data, drill two exploration wells and expend a minimum of $29.5 million ($14.8 million net to the Company). The Company fulfilled its seismic obligation when it acquired 1,175 square kilometers of 3-D seismic data at a cost of $7.5 million ($3.75 million net to the Company) in January 2007 and 524 square kilometers of 3-D seismic data during the fourth quarter of 2008 at a cost of $6.0 million ($3.0 million net to the Company).
The government-assigned working interest partner was delinquent paying their share of the costs several times in 2009 and consequently was placed in a default position. By a governmental decree dated December 1, 2010, the former partner was removed from the production sharing contract, and a one year time extension was granted for drilling the two exploration commitment wells. Following the decree, the Company and the government of Angola have been working together to obtain a replacement partner. In early 2012, the Angolan government granted a further one year extension to November 30, 2012 for drilling the two exploration commitment wells in accordance with the production sharing contract. In July 2012, the Angolan government granted an additional two year extension until November 30, 2014 to drill the two exploration commitment wells.
In the second quarter of 2012, the Company identified a potential partner to acquire the available 40% working interest and submitted the name of the interested party to the Angolan government for approval. In November 2012, the government advised the Company that it has entered into negotiations with the potential partner. The Company met with the Angolan government in January 2013 and learned the negotiations are still underway.
The remaining obligation is a two well exploration commitment. Each well is subject to a $5.0 million penalty ($10.0 million in aggregate for both wells) if not drilled during the contract term. The $10.0 million is currently recorded as restricted cash and is held at a financial institution located in the United States.
Because of the continuing uncertainty with the Angolan government approving a replacement partner, the Company has recorded a full allowance totaling $6.0 million as of December 31, 2012, against the accounts receivable from partners for the amounts owed to the Company above its 40% working interest plus the 10%
32
Table of Contents
Index to Financial Statements
carried interest. The allowance recorded in the twelve months ended December 31, 2012 totaled $1.6 million with the remainder having been recorded in 2011. The Company expects the gross receivable to be paid to the Company if a new partner in the block is approved.
Offshore Equatorial GuineaBlock P
In July 2012, the Company signed a definitive agreement with PETRONAS CARIGALI OVERSEAS SDN BHD for the purchase of a 31% working interest in Block P, located offshore Equatorial Guinea at a cost of $10.0 million. The acquisition was completed on November 1, 2012. The Company expects two exploration wells will be drilled on this block in 2013 or 2014. GEPetrol, the national oil company of Equatorial Guinea, is the operator of the block.
Onshore DomesticTexas
The Company acquired a 640 acre lease, the Hefley field, in the Granite Wash formation in North Texas in December 2010 and a 480 acre lease in the same formation in July 2011. The first well drilled in the Hefley field began production in August 2011. In November 2011, the Company commenced drilling a second well in the Hefley field and production from the well began in April, 2012. During 2012, the two wells produced approximately 10,000 Bbls of oil and 519 million cubic feet of gas net to the Company after deduction of royalty and severance taxes. A financial impairment of $7.6 million was recorded for the Hefley field in the third quarter of 2012 on the basis of production performance, projected hydrocarbon price curves, operating expenses and estimated reserves.
The Hefley field acreage is held by production. The expiration date of the primary term of the second Granite Wash lease is August 2014.
Onshore DomesticMontana
In May 2011, the Company acquired a 70% working interest in approximately 5,200 acres (3,640 net acres) in Sheridan County, Montana in the Middle Bakken formation. The Company drilled two wells on this acreage in 2012. After completion testing beginning in the fourth quarter of 2012 using electrical submersible pumps (ESPs), both of the wells drilled have been determined to be unsuccessful as the operating and water disposal costs exceeded the value of the gas and condensate produced from the wells. Dry hole cost and leasehold impairment totaling $14.2 million was recorded in the fourth quarter of 2012 related to these two wells.
In September 2011, the Company acquired a 65% working interest in approximately 22,000 gross acres (14,300 net acres) covering the Middle Bakken and deeper formations in the East Poplar unit and the Northwest Poplar field in Roosevelt County, Montana. Pursuant to the terms of the acquisition, the Company was required to drill three wells at its sole cost, one of which was required to be drilled by June 1, 2012 and the remaining two wells were required to be drilled by the end of 2012. A vertical exploration well, which met the time requirement for drilling the first well, was spudded in December 2011 to evaluate the formations. The second exploration well was drilled and completed in the Bakken/Three Forks formations. Both of these two wells were unsuccessful efforts, resulting in dry hole costs and leasehold impairment totaling $18.4 million recorded in the fourth quarter of 2012. The third obligatory well began drilling in December 2012 and is scheduled for completion testing in the Nisku formation in the first half of 2013.
Onshore DomesticSouth Dakota
In September 2012, the Company acquired a 100% working interest in approximately 10,000 acres in Harding County, South Dakota, for $1.5 million. The primary objective for this property is the Red River formation. Pursuant to the terms of the acquisition, the Company is obligated to drill and complete a well, or reenter and complete an existing well within twelve months of the acquisition date. Once this obligation is met and within sixteen months of the acquisition date, the Company must elect to proceed or withdraw from the
33
Table of Contents
Index to Financial Statements
transaction. Should the Company elect to proceed, it must pay an additional amount of approximately $3.6 million and commit to drill and complete an additional well, or reenter and complete another existing well within twelve months of the date the Company elects to proceed with the transaction. The Company drilled the initial well on the property in the first quarter of 2013, an unsuccessful effort at a cost of approximately $2.9 million. The Company will record this amount as dry hole cost in the first quarter of 2013. The Company does not have plans to proceed with additional investments on this property.
DomesticOutside Operated
The Company has minor interests in Brazos County, Texas producing from the Buda/Georgetown formations. The Company also owns certain minor non-operated interests in the Ship Shoal area of the Gulf of Mexico and in Pickens County, Alabama. During 2012, these wells produced approximately 438 Bbls of oil and 12 million cubic feet of gas net to the Company. No significant activity was undertaken on these properties in 2012 and no capital expenditures are anticipated in 2013 for these properties.
Sales Volumes, Prices, and Production Costs
Sales volumes, prices, and production costs (net to the Company) for the Companys operations for the years 2012, 2011, and 2010 are shown below.
| Year Ended December 31, | ||||||||||||||||||||||||||||||||||||
| 2012 | 2011 | 2010 | ||||||||||||||||||||||||||||||||||
| Oil Equivalent |
Oil | Gas | Oil Equivalent |
Oil | Gas | Oil Equivalent |
Oil | Gas | ||||||||||||||||||||||||||||
| Aggregate production |
||||||||||||||||||||||||||||||||||||
| (Oil equivalent in MBOE, Oil in MBbl, gas in MMcf) |
||||||||||||||||||||||||||||||||||||
| Etame |
800 | 800 | | 802 | 802 | | 641 | 641 | | |||||||||||||||||||||||||||
| Avouma/S.Tchibala |
493 | 493 | | 499 | 499 | | 540 | 540 | | |||||||||||||||||||||||||||
| Ebouri |
438 | 438 | | 563 | 563 | | 533 | 533 | | |||||||||||||||||||||||||||
| Hefley Field, USA(1) |
96 | 10 | 519 | 41 | 4 | 226 | | | | |||||||||||||||||||||||||||
| Other USA properties |
3 | 1 | 12 | 5 | 0 | 29 | 3 | 1 | 14 | |||||||||||||||||||||||||||
|
|
|
|
|
|
|
|
|
|
|
|
|
|
|
|
|
|
|
|||||||||||||||||||
| Total production |
1,829 | 1,741 | 532 | 1,911 | 1,868 | 255 | 1,717 | 1,715 | 14 | |||||||||||||||||||||||||||
|
|
|
|
|
|
|
|
|
|
|
|
|
|
|
|
|
|
|
|||||||||||||||||||
| Average Sales Price ($/unit) |
||||||||||||||||||||||||||||||||||||
| Etame |
$ | 111.24 | $ | 111.24 | $ | | $ | 111.98 | $ | 111.98 | $ | | $ | 78.38 | $ | 78.38 | $ | | ||||||||||||||||||
| Avouma/S.Tchibala |
111.24 | 111.24 | | 111.98 | 111.98 | | 78.38 | 78.38 | | |||||||||||||||||||||||||||
| Ebouri |
111.24 | 111.24 | | 111.98 | 111.98 | | 78.38 | 78.38 | | |||||||||||||||||||||||||||
| Hefley Field, USA(1) |
28.06 | 81.68 | 3.69 | 37.10 | 79.71 | 5.49 | | | | |||||||||||||||||||||||||||
| Other USA properties(3) |
28.53 | 94.24 | 2.44 | 23.67 | 89.04 | 3.20 | 39.03 | 75.08 | 4.79 | |||||||||||||||||||||||||||
|
|
|
|
|
|
|
|
|
|
|
|
|
|
|
|
|
|
|
|||||||||||||||||||
| Total average sales price ($/unit) |
$ | 106.75 | $ | 111.06 | $ | 3.66 | $ | 110.12 | $ | 111.92 | $ | 5.23 | $ | 78.31 | $ | 78.39 | $ | 4.79 | ||||||||||||||||||
|
|
|
|
|
|
|
|
|
|
|
|
|
|
|
|
|
|
|
|||||||||||||||||||
| Average Production Cost ($/unit)(2) |
||||||||||||||||||||||||||||||||||||
| Etame |
$ | 14.82 | $ | 14.82 | $ | | $ | 13.87 | $ | 13.87 | $ | | $ | 12.83 | $ | 12.83 | $ | | ||||||||||||||||||
| Avouma/S.Tchibala |
14.82 | 14.82 | | 13.87 | 13.87 | | 12.83 | 12.83 | | |||||||||||||||||||||||||||
| Ebouri |
14.82 | 14.82 | | 13.87 | 13.87 | | 12.83 | 12.83 | | |||||||||||||||||||||||||||
| Hefley Field, USA(1) |
9.13 | 9.13 | 1.52 | 20.38 | 20.38 | 3.40 | | | | |||||||||||||||||||||||||||
| Other USA properties(3) |
9.56 | 9.56 | 1.59 | 5.18 | 5.18 | 0.86 | 38.41 | 38.41 | 6.40 | |||||||||||||||||||||||||||
|
|
|
|
|
|
|
|
|
|
|
|
|
|
|
|
|
|
|
|||||||||||||||||||
| Total average production cost ($/unit) |
$ | 14.61 | $ | 14.61 | $ | 2.43 | $ | 13.99 | $ | 13.99 | $ | 2.33 | $ | 12.88 | $ | 12.88 | $ | 2.15 | ||||||||||||||||||
|
|
|
|
|
|
|
|
|
|
|
|
|
|
|
|
|
|
|
|||||||||||||||||||
| (1) | The Hefley field is the first of the two Granite Wash formation leases acquired by the Company in North Texas. |
34
Table of Contents
Index to Financial Statements
| (2) | Production cost in $/unit is the ratio of the Companys production cost over units of production. |
| (3) | Excludes the limited sales and cost data for the unsuccessful exploration efforts in Sheridan County, Montana |
RESERVE INFORMATION
The table below sets forth the Companys estimated net proved reserves for the years ended December 31, 2012, 2011, and 2010 as prepared by Netherland, Sewell & Associates, Inc. (NSAI), independent petroleum engineers. There have been no estimates of total proved net oil or gas reserves filed with or included in reports to any federal authority or agency other than the SEC since the beginning of the last fiscal year. The reserves are located in Gabon (offshore) and in Texas and Louisiana (onshore and offshore). Reserves estimated by our independent engineers at December 31, 2012, 2011, and 2010 reflect oil and natural gas spot prices based on the average prices during the 12-month period before the ending date of the period covered by this report determined as an unweighted, arithmetic average of the first-day-of-the-month price for each month within such period.
| As of December 31, | ||||||||||||
| 2012 | 2011 | 2010 | ||||||||||
| Crude Oil |
||||||||||||
| Proved Developed Reserves (MBbls) |
||||||||||||
| United States |
33 | 19 | 4 | |||||||||
| International |
3,717 | 3,835 | 5,025 | |||||||||
|
|
|
|
|
|
|
|||||||
| Total Proved Developed Reserves (MBbls) |
3,750 | 3,854 | 5,029 | |||||||||
|
|
|
|
|
|
|
|||||||
| Proved Undeveloped Reserves (MBbls) |
||||||||||||
| United States |
| 17 | | |||||||||
| International |
3,738 | 2,177 | 1,894 | |||||||||
|
|
|
|
|
|
|
|||||||
| Total Proved Undeveloped Reserves (MBbls) |
3,738 | 2,194 | 1,894 | |||||||||
|
|
|
|
|
|
|
|||||||
| Total Proved Reserves (MBbls) |
||||||||||||
| United States |
33 | 36 | 4 | |||||||||
| International |
7,455 | 6,012 | 6,918 | |||||||||
|
|
|
|
|
|
|
|||||||
| Total Proved Reserves (MBbls) |
7,488 | 6,048 | 6,922 | |||||||||
|
|
|
|
|
|
|
|||||||
| Natural Gas |
||||||||||||
| Proved Developed Reserves (MMcf) |
||||||||||||
| United States |
1,544 | 856 | 23 | |||||||||
| International |
| | | |||||||||
|
|
|
|
|
|
|
|||||||
| Total Proved Developed Reserves (MMcf) |
1,544 | 856 | 23 | |||||||||
|
|
|
|
|
|
|
|||||||
| Proved Undeveloped Reserves (MMcf) |
||||||||||||
| United States |
| 1,069 | | |||||||||
| International |
| | | |||||||||
|
|
|
|
|
|
|
|||||||
| Total Proved Undeveloped Reserves (MMcf) |
| 1,069 | | |||||||||
|
|
|
|
|
|
|
|||||||
| Total Proved Reserves (MMcf) |
||||||||||||
| United States |
1,544 | 1,925 | 23 | |||||||||
| International |
| | | |||||||||
|
|
|
|
|
|
|
|||||||
| Total Proved Reserves (MMcf) |
1,544 | 1,925 | 23 | |||||||||
|
|
|
|
|
|
|
|||||||
| Standardized measure of proved reserves (in thousands) |
$ | 152,902 | $ | 166,187 | $ | 124,824 | ||||||
|
|
|
|
|
|
|
|||||||
35
Table of Contents
Index to Financial Statements
Proved Undeveloped Reserves
The Company annually reviews all proved undeveloped reserves (PUDs) to ensure an appropriate plan for development exists. The Companys PUDs are expected to be converted to proved developed reserves within five years of the date they are first booked as PUDs. The Company had 3,738 MBbls of PUDs at December 31, 2012, compared with 2,194 MBbls and 1,069 MMcf of PUDs at December 31, 2011.
For United States operations, the Company converted all its 2011 PUDs to proved developed reserves in 2012 by drilling and placing on production the second Hefley field well at a cost of $13.6 million.
For international operations, the increase in PUDs of approximately 1.0 million Bbls was due to the successful approval of two new projects for offshore Gabon. The Company and its partners approved the construction of two additional production platforms in late 2012 as part of future development plans for the Etame Marin block. One platform will be located in the Etame field and the second platform will be located in-between the Southeast Etame and North Tchibala fields. Through the end of 2012, approximately $5.8 million had been spent on these two projects.
The remainder of the increase in PUDs of approximately 0.5 million is primarily associated with a movement from proved developed reserves to proved undeveloped reserves for the Ebouri field where H2S was discovered in July 2012 in two of the three producing wells from the platform. Analysis and options for re-establishing production from the impacted area was undertaken in the second half of 2012. The expected outcome is that additional capital investment will be required, which is likely to include a new platform-type structure with H2S processing capability, and new wells to re-establish production from the impacted area. The design, cost projections and final investment decisions by the Company and its partners are expected to be made in 2013. Re-establishing production from the area impacted by H2S is expected in the first half of 2016.
The remaining 2.2 million Bbls of PUDs are associated with drilling locations for additional wells within the Ebouri, Etame, Avouma and South Tchibala fields. Through the end of 2012, approximately $12.3 million was spent on projects in connection with converting these PUDs to proved developed reserves. These projects include the Ebouri platform well slot and power expansion project, the Avouma platform well slot and power expansion project, and the Avouma platform produced water knockout project.
Controls Over Reserve Estimates
The Companys policies and practices regarding internal controls over the recording of reserves is structured to objectively and accurately estimate our oil and gas reserves quantities and present values in compliance with the SECs regulations and GAAP. Compliance in reserves bookings is the responsibility of the Companys Vice President-Production, who is the Companys principal engineer. The Companys principal engineer has over 20 years of experience in the oil and gas industry, including over 10 years as a reserve evaluator, trainer or manager and is a qualified reserves estimator (QRE), as defined by the Society of Petroleum Engineers standards. Further professional qualifications include a degree in petroleum engineering, extensive internal and external reserve training, and asset evaluation and management. In addition, the principal engineer is an active participant in industry reserve seminars, professional industry groups and has been a member of the Society of Petroleum Engineers for over 20 years.
The Companys controls over reserve estimates included retaining NSAI as our independent petroleum and geological firm. The Company provided information about the Companys oil and gas properties, including production profiles, prices and costs, to NSAI and they prepare their own estimates of the reserves attributable to our properties. All of the information regarding reserves in this annual report is derived from the report of NSAI. The report of NSAI is included as an exhibit to this report.
The reserves estimates shown herein have been independently evaluated by NSAI, a worldwide leader of petroleum property analysis for industry and financial organizations and government agencies. NSAI was
36
Table of Contents
Index to Financial Statements
founded in 1961 and performs consulting petroleum engineering services under Texas Board of Professional Engineers Registration No. F-2699. Within NSAI, the technical persons primarily responsible for preparing the estimates set forth in the NSAI reserves report incorporated herein are Mr. Derek Newton and Mr. Pat Higgs. Mr. Newton has been practicing consulting petroleum engineering at NSAI since 1997. Mr. Newton is a Licensed Professional Engineer in the State of Texas (No. 97689) and has over 27 years of practical experience in petroleum engineering, with over 15 years experience in the estimation and evaluation of reserves. He graduated from University College, Cardiff, Wales, in 1983 with a Bachelor of Science Degree in Mechanical Engineering and from Strathclyde University, Scotland, in 1986 with a Master of Science Degree in Petroleum Engineering. Mr. Higgs has been practicing consulting petroleum geology at NSAI since 1996. Mr. Higgs is a Licensed Professional Geoscientist in the State of Texas, Geology (No. 985) and has over 36 years of practical experience in petroleum geosciences, with over 16 years experience in the estimation and evaluation of reserves. He graduated from Texas A&M University in 1976 with a Bachelor of Science Degree in Geophysics. Both technical principals meet or exceed the education, training, and experience requirements set forth in the Standards Pertaining to the Estimating and Auditing of Oil and Gas Reserves Information promulgated by the Society of Petroleum Engineers; both are proficient in judiciously applying industry standard practices to engineering and geoscience evaluations as well as applying SEC and other industry reserves definitions and guidelines.
The Audit Committee of the Board of Directors meets with management, including access to the Companys principal engineer, to discuss matters and policies related to reserves.
The following tables set forth the net proved reserves of the Company as of December 31, 2012, 2011 and 2010, and the changes during such periods.
| Oil (MBbls) | Gas (MMCF) | |||||||
| PROVED RESERVES: |
||||||||
| BALANCE AT JANUARY 1, 2010 |
7,363 | 23 | ||||||
| Production |
(1,715 | ) | (38 | ) | ||||
| Revisions of previous estimates |
1,274 | 38 | ||||||
| Extensions and discoveries |
| | ||||||
|
|
|
|
|
|||||
| BALANCE AT DECEMBER 31, 2010 |
6,922 | 23 | ||||||
| Production |
(1,868 | ) | (255 | ) | ||||
| Revisions of previous estimates |
959 | 31 | ||||||
| Extensions and discoveries |
35 | 2,126 | ||||||
|
|
|
|
|
|||||
| BALANCE AT DECEMBER 31, 2011 |
6,048 | 1,925 | ||||||
| Production |
(1,741 | ) | (532 | ) | ||||
| Revisions of previous estimates |
2,200 | 151 | ||||||
| Extensions and discoveries |
981 | | ||||||
|
|
|
|
|
|||||
| BALANCE AT DECEMBER 31, 2012 |
7,488 | 1,544 | ||||||
|
|
|
|
|
|||||
| Oil (MBbls) | Gas (MMCF) | |||||||
| PROVED DEVELOPED RESERVES |
||||||||
| Balance at January 1, 2010 |
4,795 | 23 | ||||||
| Balance at December 31, 2010 |
5,029 | 23 | ||||||
| Balance at December 31, 2011 |
3,854 | 856 | ||||||
| Balance at December 31, 2012 |
3,750 | 1,544 | ||||||
The Company does not book proved reserves on discoveries until such time as a development plan has been prepared and approved by the Companys partners in the discovery. Furthermore, if a government agreement that the reserves are commercial is required to develop the field, this approval must have been received prior to booking any reserves.
37
Table of Contents
Index to Financial Statements
There are numerous uncertainties inherent in estimating quantities of proved reserves and in projecting future rates of production and timing of development expenditures, including many factors beyond the control of the Company. Reserve engineering is a subjective process of estimating underground accumulations of oil and gas that cannot be measured in an exact manner, and the accuracy of any reserve estimate is a function of the quality of available data and of engineering and geological interpretation and judgment. The quantities of oil and gas that are ultimately recovered, production and operating costs, the amount and timing of future development expenditures and future oil and gas sales prices may all differ from those assumed in these estimates. The standardized measure of discounted future net cash flow should not be construed as the current market value of the estimated oil and natural gas reserves attributable to the Companys properties. The information set forth in the foregoing tables includes revisions for certain reserve estimates attributable to proved properties included in the preceding years estimates. Such revisions are the result of additional information from subsequent completions and production history from the properties involved or the result of a decrease (or increase) in the projected economic life of such properties resulting from changes in product prices. Moreover, crude oil amounts shown for Gabon are recoverable under a service contract and the reserves in place remain the property of the Gabon government.
In accordance with the current guidelines of the SEC, the Companys estimates of future net cash flow from the Companys properties and the present value thereof are made using oil and gas contract prices using a twelve month average price and are held constant throughout the life of the properties except where such guidelines permit alternate treatment, including the use of fixed and determinable contractual price escalations. In Gabon, the price as of December 31, 2012, was $113.08 per Bbl. In the United States, the price as of December 31, 2012, was $85.07 per Bbl of oil and $3.515 per Mcf of gas. See Note 13 to the Companys consolidated financial statements for certain additional information concerning the proved reserves of the Company.
Drilling History
In 2012, the Company drilled four wells and completed two wells reported in 2011 as being in-progress as follows: three exploratory wells in the Middle Bakken and lower formations of the East Poplar unit in Roosevelt County, Montana (2 dry, 1 in progress), two exploratory wells in the Salt Lake area in Sheridan County, Montana (2 dry) and completed the development well in the Granite Wash formation in North Texas that was reported as being in progress at the end of 2011.
| Domestic | International | |||||||||||||||||||||||||||||||||||||||||||||||
| Gross | Net | Gross | Net | |||||||||||||||||||||||||||||||||||||||||||||
| 2012 | 2011 | 2010 | 2012 | 2011 | 2010 | 2012 | 2011 | 2010 | 2012 | 2011 | 2010 | |||||||||||||||||||||||||||||||||||||
| Exploratory Wells |
||||||||||||||||||||||||||||||||||||||||||||||||
| Productive |
0.0 | 0.0 | 0.0 | 0.0 | 0.0 | 0.0 | 0.0 | 0.0 | 0.0 | 0.0 | 0.0 | 0.0 | ||||||||||||||||||||||||||||||||||||
| Dry |
4.0 | 0.0 | 0.0 | 3.3 | 0.0 | 0.0 | 0.0 | 0.0 | 1.0 | 0.0 | 0.0 | 0.3 | ||||||||||||||||||||||||||||||||||||
| In progress |
1.0 | 1.0 | 0.0 | 0.7 | 0.7 | 0.0 | 0.0 | 0.0 | 1.0 | 0.0 | 0.0 | 0.3 | ||||||||||||||||||||||||||||||||||||
| Development Wells |
||||||||||||||||||||||||||||||||||||||||||||||||
| Productive |
1.0 | 1.0 | 0.0 | 1.0 | 1.0 | 0.0 | 0.0 | 0.0 | 3.0 | 0.0 | 0.0 | 0.9 | ||||||||||||||||||||||||||||||||||||
| Dry |
0.0 | 0.0 | 0.0 | 0.0 | 0.0 | 0.0 | 0.0 | 0.0 | 0.0 | 0.0 | 0.0 | 0.0 | ||||||||||||||||||||||||||||||||||||
| In progress |
0.0 | 1.0 | 0.0 | 0.0 | 1.0 | 0.0 | 0.0 | 0.0 | 0.0 | 0.0 | 0.0 | 0.0 | ||||||||||||||||||||||||||||||||||||
|
|
|
|
|
|
|
|
|
|
|
|
|
|
|
|
|
|
|
|
|
|
|
|
|
|||||||||||||||||||||||||
| Total Wells |
6.0 | 3.0 | 0.0 | 5.0 | 2.7 | 0.0 | 0.0 | 0.0 | 5.0 | 0.0 | 0.0 | 1.5 | ||||||||||||||||||||||||||||||||||||
|
|
|
|
|
|
|
|
|
|
|
|
|
|
|
|
|
|
|
|
|
|
|
|
|
|||||||||||||||||||||||||
38
Table of Contents
Index to Financial Statements
Acreage and Productive Wells
Below is the total acreage under lease and the total number of productive oil and gas wells of the Company as of December 31, 2012:
| United States | International | |||||||||||||||
| Gross | Net(1) | Gross | Net(1) | |||||||||||||
| (Acreage in thousands) | ||||||||||||||||
| Developed acreage |
7.3 | 1.4 | 28.7 | 8.1 | ||||||||||||
| Undeveloped acreage |
27.7 | 18.4 | 59,744.4 | 18,685.7 | ||||||||||||
| Productive gas wells |
8.0 | 2.6 | 0.0 | 0.0 | ||||||||||||
| Productive oil wells |
3.0 | 0.4 | 11.0 | 3.1 | ||||||||||||
| (1) | Net acreage and net productive wells are based upon the Companys working interest in the properties. |
The leases in which we hold an interest in undeveloped acreage with minimum remaining terms are not material to us.
Office Space
The Company leases its offices in Houston, Texas (approximately 19,700 square feet), in Port Gentil, Gabon (approximately 11,300 square feet) and in Luanda, Angola (approximately 2,500 square feet), which management believes are adequate for the Companys operations.
| Item 3. | Legal Proceedings |
The Company is currently not a party to any material litigation.
| Item 4. | Mine Safety Disclosures |
Not applicable.
39
Table of Contents
Index to Financial Statements
| Item 5. | Market for Registrants Common Equity, Related Stockholder Matters and Issuer Purchases of Equity Securities |
General
The Companys common stock is traded on the New York Exchange under the symbol EGY. The following table sets forth the range of high and low sales prices of the common stock for the periods indicated.
| Period |
High | Low | ||||||
| 2011: |
||||||||
| First Quarter |
$ | 8.40 | $ | 6.53 | ||||
| Second Quarter |
7.83 | 5.29 | ||||||
| Third Quarter |
7.36 | 4.68 | ||||||
| Fourth Quarter |
7.50 | 4.57 | ||||||
| 2012: |
||||||||
| First Quarter |
$ | 9.85 | $ | 5.61 | ||||
| Second Quarter |
10.32 | 7.08 | ||||||
| Third Quarter |
9.60 | 6.88 | ||||||
| Fourth Quarter |
9.01 | 7.33 | ||||||
On February 28, 2013 the last reported sale price of the common stock on the New York Stock Exchange was $8.11 per share.
As of February 28, 2013 there were approximately 13,000 holders of record of the Companys common stock.
Dividends
The Company has not paid cash dividends and does not anticipate paying cash dividends on the common stock in the foreseeable future.
40
Table of Contents
Index to Financial Statements
Performance Graph
The following graph compares the yearly percentage change in the Companys cumulative total stockholder return on its common shares with the cumulative total return of the S&P 500 Index and the SPDR S&P Oil & Gas Exploration and Production Index. For this purpose, the yearly percentage change in the Companys cumulative total stockholder return is calculated by dividing (a) the sum of the dividends paid during the measurement period, and the difference between the price for the Companys shares at the end and the beginning of the measurement period, by (b) the price for the Companys common shares at the beginning of the measurement period. Measurement period means the period beginning at the market close on the last trading day before the beginning of the Companys fifth preceding fiscal year, through and including the end of the Companys most recently completed fiscal year. The Corporation first became listed on the New York Stock Exchange on October 12, 2006.
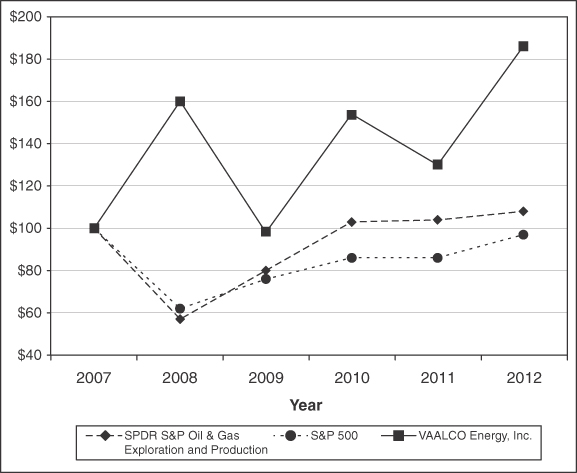
| 2007 | 2008 | 2009 | 2010 | 2011 | 2012 | |||||||||||||||||||
| SPDR S&P Oil & Gas Exploration and Production |
$ | 100 | $ | 57 | $ | 80 | $ | 103 | $ | 104 | $ | 108 | ||||||||||||
| S&P 500 Composite |
$ | 100 | $ | 62 | $ | 76 | $ | 86 | $ | 86 | $ | 97 | ||||||||||||
| VAALCO Energy, Inc. |
$ | 100 | $ | 160 | $ | 98 | $ | 154 | $ | 130 | $ | 186 | ||||||||||||
41
Table of Contents
Index to Financial Statements
Securities Authorized for Issuance under Equity Compensation Plans
The following table provides information as of December 31, 2012 regarding the number of shares of common stock that may be issued under the Companys compensation plans. Please refer to Note 3 to the consolidated financial statements for additional information on stock based compensation.
| Plan Category |
Number of securities to be issued upon exercise of outstanding options, warrants and rights |
Weighted-average exercise price of outstanding options, warrants and rights |
Number of securities remaining available for future issuance under equity compensation plans (excluding securities reflected in the first column) |
|||||||||
| Equity compensation plans approved by security holders |
1,985,959 | $ | 4.42 | 3,008,483 | ||||||||
| Equity compensation plans not approved by security holders |
2,079,649 | $ | 7.74 | 354,963 | ||||||||
|
|
|
|
|
|||||||||
| Total |
4,065,608 | $ | 6.12 | 3,363,446 | ||||||||
|
|
|
|
|
|||||||||
Issuer Purchases of Equity Securities for Year Ended December 31, 2012
The Company did not purchase any shares in the year ended December 31, 2012.
42
Table of Contents
Index to Financial Statements
| Item 6. | Selected Financial Data |
The following table sets forth, as of the dates and for the periods indicated, selected financial information about the Company. The financial information for each of the five years in the period ended December 31, 2012 has been derived from the Companys Consolidated Financial Statements for such periods. The information should be read in conjunction with Managements Discussion and Analysis of Financial Condition and Results of Operations and the Consolidated Financial Statements and Notes thereto. The following information is not necessarily indicative of the Companys future results.
| Years Ended December 31, | ||||||||||||||||||||
| 2012 | 2011 | 2010 | 2009 | 2008 | ||||||||||||||||
| (In thousands, except per share amounts) | ||||||||||||||||||||
| Total revenues |
$ | 195,287 | $ | 210,436 | $ | 134,472 | $ | 115,298 | $ | 169,525 | ||||||||||
| Net income (loss) |
$ | 5,339 | $ | 40,562 | $ | 42,387 | $ | (4,144 | ) | $ | 35,733 | |||||||||
| Net income (loss) attributable to VAALCO Energy, Inc. |
$ | 631 | $ | 34,145 | $ | 37,340 | $ | (7,889 | ) | $ | 29,722 | |||||||||
| Basic net income (loss) per share attributable to VAALCO Energy, Inc. common shareholders |
$ | 0.01 | $ | 0.60 | $ | 0.66 | $ | (0.14 | ) | $ | 0.51 | |||||||||
| Diluted net income (loss) per share attributable to VAALCO Energy, Inc. common shareholders |
$ | 0.01 | $ | 0.59 | $ | 0.65 | $ | (0.14 | ) | $ | 0.50 | |||||||||
| Total assets |
$ | 267,956 | $ | 275,015 | $ | 238,400 | $ | 202,999 | $ | 252,030 | ||||||||||
| Total debt |
$ | | $ | | $ | | $ | | $ | 5,000 | ||||||||||
43
Table of Contents
Index to Financial Statements
| Item 7. | Managements Discussion and Analysis of Financial Condition and Results of Operations |
INTRODUCTION
VAALCO owns producing properties and conducts exploration activities as an operator in Gabon, West Africa, conducts exploration activities as an operator in Angola, West Africa, conducts exploration activities as a non-operator in Equatorial Guinea, West Africa, and has conducted exploration activities as a non-operator in the British North Sea. VAALCO is the operator of unconventional and conventional resource properties in the United States located in Montana, South Dakota, and North Texas. The Company also owns minor interests in conventional production activities as a non-operator in the United States.
A significant component of the Companys results of operations is dependent upon the difference between prices received for its offshore Gabon oil production and the costs to find and produce such oil. Oil (and gas) prices have been and are expected in the future to be volatile and subject to fluctuations based on a number of factors beyond the control of the Company. Similarly, the costs to find and produce oil and gas are largely not within the control of the Company, particularly in regard to the cost of leasing drilling rigs to drill and maintain offshore wells.
A key focus of the Company is to maintain oil production from the Etame Marin block located offshore Gabon at optimal levels within the constraints of the existing infrastructure. The Company operates the Etame, Avouma, South Tchibala and Ebouri fields on behalf of a consortium of five companies. Five subsea wells plus production from two platforms are tied back by pipelines to deliver oil and associated gas through a riser system to allow for delivery, processing, storage and ultimately offloading the oil from a leased Floating, Production, Storage and Offloading vessel (FPSO) anchored to the seabed on the block. With the FPSO limitations of approximately 25,000 BOPD and 30,000 barrels of total fluids per day, the challenge is to optimize production on both a near and long-term basis subject to investment and operational agreements between the Company and the consortium.
As part of the near-term optimization, drilling and workover campaigns are developed and executed to drill new wells, partly to replace maturing wells, and to perform workovers to replace electrical submersible pumps in existing wells. Late in 2012, a drilling and workover campaign began with the arrival of a drilling rig to conduct a six well program.
Long-term optimization progress was made in 2012 by the Company and its partners approving the construction of two additional production platforms. The two production platforms are part of the future development plans for the Etame Marin block. One platform will be located in the Etame field and the second platform will be located in-between the Southeast Etame and North Tchibala fields. Multiple wells are expected to be drilled from each of the platforms. The Company drilled a successful exploration well in the Southeast Etame area in 2010 which will be developed from the second platform. The expected cost to build and install the platforms in the 2013/2014 timeframe is $275.0 million ($77.0 million net to the Company). The cost of the wells is not included in the platform costs.
In 2012 the presence of hydrogen sulfide (H2S) from two of the three producing wells in the Ebouri field was discovered. The wells were shut-in for safety reasons resulting in a decrease of approximately 2,000 BOPD or approximately 10% of the gross daily production from the Etame Marin block. Analysis and options for re-establishing production from the impacted area was undertaken in the second half of 2012. The expected outcome is that additional capital investment will be required, which is likely to include a new platform-type structure with H2S processing capability, and new wells to re-establish production from the impacted area. The design, cost projections and final investment decisions by the Company and its partners are expected to be made in 2013. Re-establishing production from the area impacted by H2S is expected in the first half of 2016.
Besides the offshore Etame Marin block in Gabon, the Company operates the Mutamba Iroru block located onshore Gabon. The Company has a 50% working interest in the block. After drilling two unsuccessful
44
Table of Contents
Index to Financial Statements
exploration wells on the block in 2009, the Company entered into an agreement with Total Gabon to continue the exploration activities. Following seismic reprocessing, a discovery well was drilled in 2012. The plan of development will be the next step undertaken which will be the focus of 2013 for this property. Development of the onshore block is expected to capitalize on synergies such as office space, warehouse and open yard space and experienced personnel from our operating base in Port Gentil, Gabon.
An important item for the Company is growth in terms of establishing meaningful production operations in more than one country. The Company routinely evaluates working interest opportunities primarily in the West African geographic area where the Company has significant expertise and where the base of the foreign operations is located. During 2012, the Company identified an opportunity to purchase a working interest in Block P, Equatorial Guinea. In November 2012, the Company completed the acquisition of a 31% working interest in the block at a cost of $10.0 million. Prior to the Companys acquisition, two recent oil discoveries had been made on the block, and there is exploration potential on other areas of the block. The Company expects to participate in the drilling of two exploration wells in the 2013/2014 time horizon.
With a focus on diversification and utilizing available capital resources, the Company invested in three non-conventional acreage acquisitions in Texas and Montana in late 2010 and in 2011. Two wells have been drilled on the Texas acreage and brought on production. The second well began production in March 2012. In Montana, four unsuccessful exploration wells were drilled on the two properties in 2012. The outcome of the fifth well drilled in Montana in 2012 will be determined in the first half of 2013. With the unsuccessful results in Montana and increasing opportunities available to the Company internationally, the Company is not expecting to focus on further domestic property acquisitions in the near term.
CRITICAL ACCOUNTING POLICIES
The following describes the critical accounting policies used by the Company in reporting its financial condition and results of operations. In some cases, accounting standards allow more than one alternative accounting method for reporting, such is the case with accounting for oil and gas activities described below. In those cases, the Companys reported results of operations would be different should it employ an alternative accounting method.
Successful Efforts Method of Accounting for Oil and Gas activities
The SEC prescribes in Regulation S-X the financial accounting and reporting standards for companies engaged in oil and gas producing activities. Two methods are prescribed: the successful efforts method and the full cost method. Like many other oil and gas companies, the Company has chosen to follow the successful efforts method. Management believes that this method is preferable, as the Company has focused on exploration activities wherein there is risk associated with future success and as such earnings are best represented by attachment to the drilling operations of the Company. Costs of successful wells, development dry holes and leases containing productive reserves are capitalized and amortized on a unit-of-production basis over the life of the related reserves. Other exploration costs, including geological and geophysical expenses applicable to undeveloped leasehold, leasehold expiration costs and delay rentals are expensed as incurred.
In accordance with the successful efforts method of accounting, the Company reviews proved oil and gas properties for indications of impairment whenever events or circumstances indicate that the carrying value of its oil and gas properties may not be recoverable. When it is determined that an oil and gas propertys estimated future net cash flows will not be sufficient to recover its carrying amount, an impairment charge must be recorded to reduce the carrying amount of the asset to its estimated fair value. This may occur if a field contains lower than anticipated reserves or if commodity prices fall below a level that significantly effects anticipated future cash flows on the field.
45
Table of Contents
Index to Financial Statements
Impairment of Unproved Property
The Company evaluates its unproved properties for impairment on a property-by-property basis. The majority of the Companys unproved property consists of acquisition costs related to its undeveloped acreage in Angola, Equatorial Guinea and in the United States. On at least a quarterly basis, management reviews the unproved property for indicators of impairment based on the Companys current exploration plans with consideration given to results of any drilling and seismic activity during the period and known information regarding exploration activity by other companies on adjacent blocks. See Item 2Properties and Note 6 to the consolidated financial statements for further information on the Companys exploration plans in Angola and Equatorial Guinea.
In Angola, any adverse developments related to the Companys ability to further extend the drilling obligation date, if necessary, could result in an impairment of the Companys unproved properties and other assets with a carrying value of approximately $11.0 million.
In the United States, the Company recorded an impairment loss of $7.6 million in 2012 to write down the value of its unproved property, due to its unsuccessful exploration activities ($3.8 million in Roosevelt County, Montana, $2.3 million in Sheridan County, Montana, and $1.5 million in Harding County, South Dakota).
Asset Retirement Obligations (ARO)
The Company has significant obligations to remove tangible equipment and restore land or seabed at the end of oil and gas production operations. The Companys removal and restoration obligations are primarily associated with plugging and abandoning wells, removing and disposing of all or a portion of offshore oil and gas platforms, and capping pipelines. Estimating the future restoration and removal costs is difficult and requires management to make estimates and judgments. Asset removal technologies and costs are constantly changing, as are regulatory, political, environmental, safety, and public relations considerations.
ARO associated with retiring tangible long-lived assets is recognized as a liability in the period in which the legal obligation is incurred and becomes determinable. The liability is offset by a corresponding increase in the underlying asset. The ARO liability reflects the estimated present value of the amount of dismantlement, removal, site reclamation, and similar activities associated with The Companys oil and gas properties. The Company utilizes current retirement costs to estimate the expected cash outflows for retirement obligations. Inherent in the present value calculation are numerous assumptions and judgments including the ultimate settlement amounts, inflation factors, credit-adjusted discount rates, timing of settlement, and changes in the legal, regulatory, environmental, and political environments. To the extent future revisions to these assumptions impact the present value of the existing ARO liability, a corresponding adjustment is made to the oil and gas property balance. Accretion expense is recognized over time as the discounted liability is accreted to its expected settlement value.
CAPITAL RESOURCES AND LIQUIDITY
Cash Flows
Net cash provided by operating activities for 2012 was $94.0 million, as compared to $89.6 million in 2011 and $45.5 million in 2010. The increase in cash provided by operating activities in 2012 versus 2011 was primarily due to both an increase in non-cash adjustments to net income of $31.3 million and an $8.3 million positive variance in changes in operating assets and liabilities, partially offset by a $35.2 million reduction in net income. The increase in cash provided by operating activities in 2011 versus 2010 was primarily due to a $32.5 million positive variance in changes in operating assets and liabilities and increased non-cash adjustments to net income of $13.4 million.
46
Table of Contents
Index to Financial Statements
Net cash used in investing activities in 2012 was $71.8 million, compared to net cash used in investing activities for 2011 of $28.4 million and net cash used in investing activities in 2009 of $39.4 million. In 2012, the Company paid $71.9 million for capital expenditures, partly offset by a $0.1 million release of restricted cash. The Company paid $32.0 million for capital expenditures in 2011, partially offset by a $3.6 million release of restricted cash. In 2010, the Company paid $40.0 million for capital expenditures, partially offset by a $0.6 million release of restricted cash.
In 2012, cash used in financing activities was $28.5 million consisting of an acquisition of a noncontrolling interest for $ 26.2 million and distributions to a noncontrolling interest owner of $5.6 million, partially offset by proceeds from the issuance of common stock upon the exercise of options of $3.3 million. In 2011, cash used in financing activities was $5.3 million consisting of distributions to a noncontrolling interest owner of $7.2 million partially offset by proceeds from the issuance of common stock upon the exercise of options of $1.9 million. In 2010, cash used in financing activities was $5.5 million, consisting primarily of distributions to a noncontrolling interest owner of $6.0 million partially offset by proceeds from the issuance of common stock upon the exercise of options of $0.5 million.
In recent history, the Companys primary source of capital resources has been from cash flows from operations. On December 31, 2012, the Company had cash balances of $130.8 million and restricted cash of $12.1 million. The Company believes that these cash balances combined with cash flow from operations will be sufficient to fund the Companys 2013 capital expenditure budget, which is expected to total approximately $75.0 million to: further develop the Etame Marin block offshore Gabon with a three well drilling program; to fund construction costs for two platforms being built for the Etame Marin block; potential exploration drilling of one well on Block 5 in Angola or Block P in Equatorial Guinea; final expenditures for an unsuccessful exploration well in the Salt Lake area in Sheridan County, Montana; completion of an exploration well in the East Poplar unit in Roosevelt County, Montana; and the drilling of an exploration well in Harding County, South Dakota.
The Company invests cash not required for immediate operational and capital expenditure needs in short-term bankers acceptance and money market instruments primarily with JPMorgan Chase & Co. The Company does not invest in the asset-backed commercial paper market which has been subject to a liquidity crisis over the last few years. As operator of the Etame, Avouma, South Tchibala and Ebouri producing fields, and the Southeast Etame and North Tchibala fieds currently being developed, the Company enters into project related activities on behalf of its working interest partners. The Company generally obtains advances from its partners prior to significant funding commitments.
Capital Expenditures
In 2012, the Company invested $46.4 million in property and equipment additions (including amounts carried in accounts payable and excluding exploration dry hole costs), primarily associated with $13.6 million to drill and complete the second Granite Wash formation well in the United States and one exploratory well in Montana, $16.7 million for platform modifications and production facilities offshore Gabon, $10.0 million to acquire mineral interests in Block P offshore Equatorial Guinea, and $6.0 million to drill an exploratory well onshore Gabon. In 2011, the Company invested $33.0 million in property and equipment additions, primarily associated with $9.5 million to acquire leases in the United States, $14.9 million to drill three wells in the United States, and $7.4 million primarily for offshore platform modifications and production facilities in Gabon. During 2010, the Company invested $40.5 million in property and equipment additions, primarily associated with the drilling of three development wells in the Etame Marin block offshore Gabon totaling $29.3 million. In addition, in 2010, one successful exploration well was drilled in the Southeast Etame area of the Etame Marin block at a cost of $8.0 million, and the Company invested in a Granite Wash formation lease in Texas ($2.2 million) and a second extension of the Mutamba Iroru block onshore Gabon ($1.2 million).
47
Table of Contents
Index to Financial Statements
Oil and Gas Exploration Costs
As described above, the Company uses the successful efforts method of accounting for its oil and gas exploration and development costs. All expenditures related to exploration, with the exception of costs of drilling exploration wells, are charged as an expense when incurred. The costs of exploration wells are capitalized pending determination of whether commercially producible oil and gas reserves have been discovered. If the determination is made that a well did not encounter potentially economic oil and gas quantities, the well costs are charged as an expense. Exploration expense in 2012 was $41.0 million, including a $37.3 million in write-off costs related to five unsuccessful exploration wells in the United States, and $0.9 million spent for various geological and leasehold related activities in the United States. Additionally, in 2012 the Company incurred exploration expenditures of $2.8 million internationally for various geological and geophysical activities. In 2011, the Company incurred $5.7 million in exploration expense, including $2.0 million spent in the United States and Canada (primarily exploration well costs), $1.9 million offshore Gabon (primarily seismic acquisition costs), $0.8 million onshore Gabon (seismic reprocessing costs), $0.4 million in the United Kingdom (residual exploration well costs), and $0.6 million in Angola (exploration well preparation costs). In 2010, the Company incurred $6.8 million in exploration expense, including $2.6 million on the Omangou unsuccessful exploration well offshore Gabon, $1.4 million for seismic costs in the Etame Marin block offshore Gabon, onshore Gabon exploration expense of $0.7 million, and $0.9 million in Angola.
Contractual Obligations
The table below summarizes the Companys net share of obligations and commitments at December 31, 2012:
Payment Period
| (in thousands $) |
2013 | 2014 | 2015 | 2016 | 2017 | Thereafter | Total | |||||||||||||||||||||
| Operating leases(1) |
$ | 9,570 | $ | 9,272 | $ | 9,191 | $ | 8,697 | $ | 7,689 | $ | 22,002 | $ | 66,421 | ||||||||||||||
| 1. | The Company is guarantor of a lease for the FPSO utilized in Gabon, which has remaining obligations of $205.5 million. The Companys share of these payments is included in the table above. Approximately 72% of the payment is co-guaranteed by the Companys partners in Gabon. In addition to the FPSO amounts, the schedule includes the Companys share of its other lease obligations. |
In addition to the contractual obligations described above, the Company entered into a sixth exploration period extension during 2009 and is required to spend $5.3 million for its share of two exploration wells and acquire/process 150 square kilometers of 3-D seismic on the Etame Marin block by July 2014. One of the two exploration commitment wells was drilled in 2010 on the Omangou prospect at a cost of $8.6 million ($2.6 million net to the Company). The seismic obligation was met with the acquisition of 223 square kilometers of 3-D seismic in 2012. The remaining obligation is the drilling of one exploration well which is scheduled for drilling in mid-2013.
As part of securing the second ten year production license with the government of Gabon, the Company agreed in principle to a cash funding arrangement for the eventual abandonment of the offshore wells, platforms and facilities. The agreement is not yet finalized, but calls for annual funding for the next seven years at 12.14% of the abandonment estimate and 5.0% for the last three years of the production license. The amounts paid will be reimbursed through the cost account and are non-refundable to the Company. The funding is expected to begin in 2013 after the agreement is finalized. The abandonment estimate for this purpose is estimated to be approximately $9.7 million net to the Company on an undiscounted basis. As in prior periods, the obligation for abandonment of the Gabon offshore facilities is included in the asset retirement obligation shown on the Companys balance sheet.
48
Table of Contents
Index to Financial Statements
The Company also entered into the second exploration period for the Mutamba Iroru block which requires the Company to reprocess 400 kilometers of 2-D seismic and drill one exploration well by May 2012. The seismic reprocessing work was completed in 2012. The exploration well was drilled in 2012 resulting in a discovery. A plan of development is expected to be completed for the NGongui field and submitted to the government of Gabon in 2013. In return for funding 75% of the work commitment (seismic reprocessing and exploration well costs), Total Gabon earned a 50% interest on the permit.
In 2010, the exploration permit was successfully extended until May 2012 and an application for a further nine-month extension was made in early 2012. In a letter agreement from the government of Gabon, the terms of the extension to March 2013 were agreed upon, yet the extension amendment was not executed by the government of Gabon. The Company and Total are working with the Gabon government in 2013 to finalize the extension and to obtain a further exploration extension. However, the Company can provide no assurances that such a request will be granted. The Company believes the discovery area is not impacted by the uncertainty of the extension agreement as the well was drilled during the contracted period and application of the discovery was timely made to the government of Gabon.
In November 2006, the Company signed a production sharing contract for Block 5 offshore Angola. The four year primary term with an optional three year extension awards the Company exploration rights to 1.4 million acres offshore central Angola. The Companys working interest is 40%. Additionally, the Company is required to carry the Angolan national oil company, Sonangol P&P, for 10% of the work program. During the first four years of the contract the Company was required to acquire and process 1,000 square kilometers of 3-D seismic data, drill two exploration wells and expend a minimum of $29.5 million ($14.8 million net to the Company). The Company fulfilled its seismic obligation when it acquired 1,175 square kilometers of 3-D seismic data at a cost of $7.5 million ($3.75 million net to the Company) in January 2007 and 524 square kilometers of 3-D seismic data during the fourth quarter of 2008 at a cost of $6.0 million ($3.0 million net to the Company).
The government-assigned working interest partner was delinquent paying their share of the costs several times in 2009 and consequently was placed in a default position. By a governmental decree dated December 1, 2010, the former partner was removed from the production sharing contract, and a one year time extension was granted for drilling the two exploration commitment wells. Following the decree, the Company and the government of Angola have been working together to obtain a replacement partner. In early 2012, the Angolan government granted a further one year extension to November 30, 2012 for drilling the two exploration commitment wells in accordance with the production sharing contract. In July 2012, the Angolan government granted an additional two year extension until November 30, 2014 to drill the two exploration commitment wells.
In the first quarter of 2012, the Company provided the Angolan government with a written offer that would allow the Company to proceed with exploration activities without obtaining a new partner, subject to certain criteria including changes to the work commitment and working interest percentages. In the second quarter of 2012, the Company identified a potential partner to acquire the available 40% working interest and submitted the name of the interested party to the Angolan government for approval. In November 2012, the government advised the Company that it has entered into negotiations with the potential partner. The Company met with the Angolan government in January 2013 and learned the negotiations are still underway.
The remaining obligation is a two well exploration commitment. Each well is subject to a $5.0 million penalty ($10.0 million in aggregate for both wells) if not drilled during the contract term. The $10.0 million is currently recorded as restricted cash and is held at a financial institution located in the United States.
Because of the continuing uncertainty with the Angolan government approving a replacement partner, the Company has recorded a full allowance totaling $6.0 million as of December 31, 2012, against the accounts receivable from partners for the amounts owed to the Company above its 40% working interest plus the 10% carried interest. The allowance recorded in the twelve months ended December 31, 2012 totaled $1.6 million with the remainder having been recorded in 2011. The Company expects the gross receivable to be paid to the Company if a new partner in the block is approved.
49
Table of Contents
Index to Financial Statements
The Company is carrying $10.4 million of asset retirement obligations as of December 31, 2012, representing the present value of these obligations as of that date.
RESULTS OF OPERATIONS
Year Ended December 31, 2012 Compared to Years Ended December 31, 2011 and 2010
Total Revenues
Total oil and gas sales for 2012 were $195.3 million as compared to $210.4 million and $134.5 million for 2011 and 2010, respectively.
Oil Revenues
Gabon
Crude oil revenues for 2012 were $192.5 million, as compared to revenues of $208.8 million and $134.5 million for 2011 and 2010 respectively. In 2012, the Company sold approximately 1,730,000 net barrels of oil at an average price of $111.24/Bbl. In 2011, the Company sold approximately 1,864,000 net barrels of oil at an average price of $111.98. In 2010, the Company sold approximately 1,714,000 net barrels of oil at an average price of $78.38/Bbl.
United States
Condensate sales from the Granite Wash formation wells, located in Hemphill County, Texas for the year 2012 were $0.8 million, resulting from the sale of approximately 10,000 net barrels of oil condensate at an average price of $81.68/Bbl. For the same period in 2011, condensate sales from the Granite Wash formation wells were $0.3 million, resulting from the sale of approximately 4,000 net barrels of oil condensate at an average price of $79.71/Bbl. There were no condensate sales from the Granite Wash formation wells in 2010.
Natural Gas Revenues
United States
Natural gas revenues including revenues from natural gas liquids for the year 2012 were $1.9 million compared to $1.3 million and $0.1 million for the years 2011 and 2010 respectively. In 2012, natural gas sales were 532 MMcf at an average price of $3.66/Mcf. In 2011, natural gas sales including revenues from natural gas liquids were 255 MMcf at an average price of $5.23/Mcf. In 2010, natural gas sales including revenues from natural gas liquids were 14 MMcf at an average price of $4.79/Mcf.
Operating Costs and Expenses
Production expense for 2012 was $26.7 million as compared to $26.7 million and $22.1 million for 2011 and 2010, respectively. In 2012, the Company incurred lower Domestic Market Obligation payments to the Republic of Gabon of $1.8 million, and lower fuel expense of $0.7 million, which were partially offset by higher FPSO facility costs of $2.5 million as a result of a contract extension and revision. Production expense was higher in 2011 as compared to 2010 as the result of higher sales volumes and higher Domestic Market Obligation payments to the Republic of Gabon. Any production expenses associated with unsold crude oil inventory are capitalized.
Exploration expense in 2012 was $41.0 million, including a $37.3 million in write-off costs related to five unsuccessful exploration wells in the United States, and $0.9 million spent for various geological and leasehold related activities in the United States. Additionally, in 2012 the Company incurred exploration expenditures of $2.8 million internationally for various geological and geophysical activities. In 2011, the Company incurred
50
Table of Contents
Index to Financial Statements
$5.7 million in exploration expense, including $2.0 million spent in the United States and Canada (primarily exploration well costs), $1.9 million offshore Gabon (primarily seismic acquisition costs), $0.8 million onshore Gabon (seismic reprocessing costs), $0.4 million in the United Kingdom (residual exploration well costs), and $0.6 million in Angola (exploration well preparation costs). In 2010, exploration expense was $6.8 million, primarily comprised of $2.6 million on the Omangou unsuccessful exploration well offshore Gabon, $1.4 million for seismic costs in the Etame Marin block offshore Gabon, onshore Gabon exploration expense of $0.7 million, and $0.9 million in Angola primarily for geotechnical studies.
Depreciation, depletion and amortization expense was $19.9 million in 2012 as compared to $25.6 million and $20.0 million for 2011 and 2010, respectively. Depletion, depreciation and amortization expense decreased in 2012 versus 2011 due to both lower sales volumes and lower depletion rates in 2012. The 2011 depletion, depreciation and amortization rates increased in 2011 versus 2010 due to both higher sales volumes and higher depletion rates. The 2012 depletion rates for the Ebouri field averaged $21.14 per Bbl, Avouma and South Tchibala fields averaged $4.11 per Bbl, and the Etame field averaged $4.64 per Bbl. Depletion rates for the Granite Wash wells averaged $6.16 per Mcf.
General and administrative expense for 2012 was $11.8 million as compared to $10.4 million and $7.4 million for 2011 and 2010, respectively. The increase in general and administrative expenses for 2012 versus 2011 was primarily due to higher administrative costs related to the Companys staffing expansion to accommodate the increased exploration and development activities. The increase in general and administrative expense for 2011 versus 2010 was primarily due to $3.7 million lower overhead reimbursement associated with lower capital expenditures offshore Gabon.
During 2012, the Company incurred $2.4 million of non-cash stock based compensation expense, as compared to $2.2 million and $1.8 million for 2011 and 2010, respectively. In each of the three years, the Company benefited from overhead reimbursement associated with production and development operations on the Etame Marin block.
During 2012 and 2011, the Company recorded bad debt provisions of $1.6 million and $4.4 million, respectively, related to the uncertainty in collecting its joint venture receivable in Angola.
During 2012 and 2011, the Company recorded impairment losses of $7.6 million and $5.0 million, respectively, on its proved property, to write down its investment in the Granite Wash formation of North Texas to its fair value.
Operating Income
Operating income for 2012 was $86.6 million as compared to $132.6 million and $78.1 million for 2011 and 2010, respectively. The lower operating income for 2012 versus 2011 is primarily attributable to lower sales volumes and higher exploration costs resulting from charges recorded to write off the companys unsuccessful efforts in the United States. The higher operating income in 2011 versus 2010 was attributable to both higher sales volumes and higher average crude sales prices of $111.92 per Bbl, an increase of $33.55 per Bbl over 2010.
Other Income (Expense)
Interest income for 2012 was $0.1 million compared to $0.2 million and $0.2 million for each of the years 2011 and 2010. All 2012, 2011, and 2010 amounts represent interest earned and accrued on cash balances and restricted cash.
During 2012, other income was $0.4 million as compared to other income of $1.3 million for 2011 and other expense of $0.6 million for 2010. Other income and expense is primarily the result of foreign currency transaction gains and losses from the Companys foreign operations.
51
Table of Contents
Index to Financial Statements
Income Taxes
In 2012, the Company incurred $81.8 million in income taxes as compared to $93.5 million and $35.3 million for 2011 and 2010, respectively. All income tax expenses were associated with the Etame Marin block production, and were incurred in Gabon. The lower income tax expense for 2012 versus 2011 was primarily the result of lower sales volumes, resulting in lower profit oil barrels subject to taxes. The higher income tax expense in Gabon in 2011 versus 2010 is a function of higher sales volumes, significantly higher oil prices, and modest costs incurred, resulting in higher profit oil barrels subject to taxes. After deducting royalty and cost oil, the remaining barrels are profit oil barrels which bear income tax.
Net Income
Net income for 2012 was $5.3 million compared to $40.6 million and $42.4 million for 2011 and 2010, respectively. The decrease in net income in 2012 versus 2011 is the result of lower sales volumes and higher exploration costs, partially offset by lower income taxes. The decrease in net income in 2011 versus 2010, despite higher sales volumes and average oil prices, was due to higher income taxes and one-time charges for bad debt expense and impairment losses.
Income attributable to the noncontrolling interest in the Gabon subsidiary was $4.7 million for 2012 prior to acquisition, as compared to $6.4 million and $5.0 million for 2011, and 2010, respectively. The noncontrolling interest was acquired by the Company at a cost of $26.2 million effective October 1, 2012.
NEW ACCOUNTING PRONOUNCEMENTS
None.
OFF BALANCE SHEET ARRANGEMENTS
For a discussion of off balance sheet arrangements associated with the guarantee by the Company of the charter payments for the FPSO located in Gabon, see Note 6 to the consolidated financial statements.
| Item 7A. | Quantitative and Qualitative Disclosures About Market Risk |
Market Risk
The Companys major market risk exposure continues to be the prices applicable to its oil and gas production. Sales prices are primarily driven by the prevailing market price. Historically, prices received for oil and gas production have been volatile and unpredictable.
Foreign Exchange Risk
Our results of operations and financial condition are affected by currency exchange rates. While oil sales are denominated in U.S. dollars, portions of our operating costs in Gabon are denominated in the local currency. A weakening U.S. dollar will have the effect of increasing operating costs while a strengthening U.S. dollar will have the effect of reducing operating costs. The Gabon local currency is tied to the Euro. The exchange rate between the Euro and the U.S. dollar has fluctuated widely in response to international political conditions, general economic conditions and other factors beyond our control.
Interest Rate Risk
At December 31, 2012, the Company did not have any debt and thus no exposure to interest rate risk on debt. Interest earned on cash investments is immaterial.
52
Table of Contents
Index to Financial Statements
Commodity Price Risk
The Company had no derivatives in place as of the date of this report, or throughout 2012, 2011 or 2010.
| Item 8. | Financial Statements and Supplementary Data |
The information required here is included in the report as set forth in the Index to Consolidated Financial Information on page F-1.
| Item 9. | Changes in and Disagreements with Accountants on Accounting and Financial Disclosure |
None.
| Item 9A. | Controls and Procedures |
Disclosure Controls and Procedures
The Company maintains disclosure controls and procedures that are designed to provide reasonable assurance that information required to be disclosed by the Company in the reports it files or submits under the Securities Exchange Act of 1934, as amended (the Exchange Act), is recorded, processed, summarized and reported within the time periods specified in the SECs rules and forms, and that such information is accumulated and communicated to the Companys management, including the Chief Executive Officer and Chief Financial Officer, to allow timely decisions regarding required disclosure. The Companys management, including the Companys principal executive officer and principal financial officer, has evaluated the effectiveness of the Companys disclosure controls and procedures (as defined in Rules 13a-15(e) and 15d-15(e) under the Exchange Act) as of the end of the period covered by this Annual Report on Form 10-K. Based on that evaluation, the Companys principal executive officer and principal financial officer have concluded that the Companys disclosure controls and procedures were effective as of the end of the period covered by this Annual Report on Form 10-K.
Managements Annual Report on Internal Control Over Financial Reporting
The Companys management is responsible for establishing and maintaining adequate internal control over financial reporting for the Company, as such term is defined in Rules 13a-15(f) and 15d-15(f) under the Exchange Act. Under the supervision and with the participation of the Companys management, including the Companys principal executive and principal financial officers, the Company conducted an evaluation of the effectiveness of its internal control over financial reporting based on the framework in Internal ControlIntegrated Framework issued by the Committee of Sponsoring Organizations of the Treadway Commission (the COSO Framework). Based on this evaluation under the COSO Framework, management concluded that its internal control over financial reporting was effective as of December 31, 2012.
Deloitte & Touche LLP, the independent registered public accounting firm, has issued an attestation report on the Companys internal control over financial reporting.
Changes in Internal Control Over Financial Reporting
No change in our internal control over financial reporting (as defined in Rule 13a-15(f) under the Exchange Act) occurred during the fourth quarter of our fiscal year ended December 31, 2012 that has materially affected, or is reasonable likely to materially affect, our internal control over financial reporting.
53
Table of Contents
Index to Financial Statements
REPORT OF INDEPENDENT REGISTERED PUBLIC ACCOUNTING FIRM
To the Board of Directors and Stockholders of VAALCO Energy, Inc. and subsidiaries:
We have audited the internal control over financial reporting of VAALCO Energy, Inc. and subsidiaries (the Company) as of December 31, 2012, based on criteria established in Internal ControlIntegrated Framework issued by the Committee of Sponsoring Organizations of the Treadway Commission. The Companys management is responsible for maintaining effective internal control over financial reporting and for its assessment of the effectiveness of internal control over financial reporting, included in the accompanying Managements Annual Report on Internal Control Over Financial Reporting. Our responsibility is to express an opinion on the Companys internal control over financial reporting based on our audit.
We conducted our audit in accordance with the standards of the Public Company Accounting Oversight Board (United States). Those standards require that we plan and perform the audit to obtain reasonable assurance about whether effective internal control over financial reporting was maintained in all material respects. Our audit included obtaining an understanding of internal control over financial reporting, assessing the risk that a material weakness exists, testing and evaluating the design and operating effectiveness of internal control based on the assessed risk, and performing such other procedures as we considered necessary in the circumstances. We believe that our audit provides a reasonable basis for our opinion.
A companys internal control over financial reporting is a process designed by, or under the supervision of, the companys principal executive and principal financial officers, or persons performing similar functions, and effected by the companys board of directors, management, and other personnel to provide reasonable assurance regarding the reliability of financial reporting and the preparation of financial statements for external purposes in accordance with generally accepted accounting principles. A companys internal control over financial reporting includes those policies and procedures that (1) pertain to the maintenance of records that, in reasonable detail, accurately and fairly reflect the transactions and dispositions of the assets of the company; (2) provide reasonable assurance that transactions are recorded as necessary to permit preparation of financial statements in accordance with generally accepted accounting principles, and that receipts and expenditures of the company are being made only in accordance with authorizations of management and directors of the company; and (3) provide reasonable assurance regarding prevention or timely detection of unauthorized acquisition, use, or disposition of the companys assets that could have a material effect on the financial statements.
Because of the inherent limitations of internal control over financial reporting, including the possibility of collusion or improper management override of controls, material misstatements due to error or fraud may not be prevented or detected on a timely basis. Also, projections of any evaluation of the effectiveness of the internal control over financial reporting to future periods are subject to the risk that the controls may become inadequate because of changes in conditions, or that the degree of compliance with the policies or procedures may deteriorate.
In our opinion, the Company maintained, in all material respects, effective internal control over financial reporting as of December 31, 2012, based on the criteria established in Internal ControlIntegrated Framework issued by the Committee of Sponsoring Organizations of the Treadway Commission.
We have also audited, in accordance with the standards of the Public Company Accounting Oversight Board (United States), the consolidated financial statements as of and for the year ended December 31, 2012 of the Company, and our report dated March 14, 2013 expressed an unqualified opinion on those consolidated financial statements.
/s/ DELOITTE & TOUCHE LLP
Houston, Texas
March 14, 2013
54
Table of Contents
Index to Financial Statements
| Item 9B. | Other Information |
The Company has disclosed all information required to be disclosed in a current report on Form 8-K during the year ended December 31, 2012 in previously filed reports on Form 8-K.
| Item 10. | Directors, Executive Officers and Corporate Governance |
Information required by this item will be included in the Companys proxy statement for its 2013 annual meeting, which will be filed with the Commission within 120 days of December 31, 2012, and which is incorporated herein by reference.
| Item 11. | Executive Compensation |
Information required by this item will be included in the Companys proxy statement for its 2013 annual meeting, which will be filed with the Commission within 120 days of December 31, 2012, and which is incorporated herein by reference.
| Item 12. | Security Ownership of Certain Beneficial Owners and Management and Related Stockholder Matters |
Information required by this item under Item 403 of Regulation S-K concerning the security ownership of certain beneficial owners and management will be included in the Companys proxy statement for its 2013 annual meeting, which will be filed with the Commission within 120 days of December 31, 2012, and which is incorporated herein by reference. Please see Item 5Market for Registrants Common Equity, Related Stockholder Matters and Issuer Purchase of Equity Securities for information on securities that may be issued under the Companys stock incentive plans.
| Item 13. | Certain Relationships and Related Transactions, and Director Independence |
Information required by this item will be included in the Companys proxy statement for its 2013 annual meeting, which will be filed with the Commission within 120 days of December 31, 2012, and which is incorporated herein by reference.
| Item 14. | Principal Accountant Fees and Services |
The information required by this item is incorporated by reference from the Companys definitive proxy statement for its 2013 annual meeting, which will be filed with the Commission within 120 days of December 31, 2012, and which is incorporated herein by reference.
55
Table of Contents
Index to Financial Statements
| Item 15. | Exhibits and Financial Statement Schedules |
| (a) | 1. The following is an index to the financial statements that are filed as part of this Form 10-K. |
| (a) | 2. Schedules are omitted because they are not required, not applicable or the required information is included in the financial statements or notes thereto. |
| (a) | 3. Exhibits: |
| 3. | Articles of Incorporation and Bylaws |
| 3.1(a) | Restated Certificate of Incorporation | |||
| 3.2(a) | Certificate of Amendment to Restated Certificate of Incorporation | |||
| 3.3(j) | Amended and Restated Bylaws | |||
| 10. | Material Contracts |
| 10.1(b) | Indemnity Agreement entered into among the Company and certain of its officers and directors listed therein. | |||
| 10.2(c) | Exploration and Production Sharing contract between the Republic of Gabon and VAALCO Gabon (Etame), Inc. dated July 7, 1995. | |||
| 10.3(c) | Deed of Assignment and Assumption between VAALCO Gabon (Etame), Inc., VAALCO Energy (Gabon), Inc. and Petrofields Exploration & Development Co., Inc. dated September 28, 1995. | |||
| 10.4(d) | Letter of Intent for Etame Marin block, Offshore Gabon dated January 22, 1998 between the Company and Western Atlas International, Inc. | |||
| 10.5(e) | 2001 Stock Incentive Plan dated August 16, 2001. | |||
| 10.6(f) | Trustee and Paying Agent Agreement by and between VAALCO Gabon (Etame), Inc., J.P. Morgan Trustee and Depositary Company Limited and JPMorgan Chase Bank, London Branch, dated June 26, 2002. | |||
| 10.7(g) | 2003 Stock Incentive Plan dated December 16, 2003. | |||
56
Table of Contents
Index to Financial Statements
| 10.8(h) | Exploration and Production Sharing contract between the Republic of Gabon and VAALCO Production (Gabon), Inc., Permit Mutamba Iroru dated November 11, 2005. | |||
| 10.9(i) | 2007 Stock Incentive Plan dated May 1, 2007. | |||
| 10.11(k) | Settlement Agreement, dated as of May 23, 2008 by and among the Company and Nanes Delorme Partners I LP, Nanes Balkany Partners LLC, Nanes Balkany Management LLC, Julien Balkany and Daryl Nanes. | |||
| 10.12(l) | Production Sharing Agreement between Sonangol, E.P. and VAALCO Angola (Kwanza), Inc. dated November 1, 2006. | |||
| 21. | Subsidiaries of the Company |
| 21.1 | Subsidiaries of the Registrant |
| 23. | Consents of Experts and Counsel |
| 23.1 | Consent of Deloitte & Touche LLP |
| 23.2 | Consent of Netherland, Sewell & Associates, Inc. |
| 31. | Rule 13a-14(a) Certifications |
| 31.1 | Certification pursuant to section 302 of the Sarbanes-Oxley Act of 2002 |
| 31.2 | Certification pursuant to section 302 of the Sarbanes-Oxley Act of 2002 |
| 32. | Section 1350 Certifications |
| 32.1 | Certification pursuant to 18 U.S.C. Section 1350, as adopted pursuant to Section 906 of the Sarbanes-Oxley Act Of 2002 |
| 32.2 | Certification pursuant to 18 U.S.C. Section 1350, as adopted pursuant to Section 906 of the Sarbanes-Oxley Act Of 2002 |
| 99. | Reserve Report |
| 99.1 | Report of Netherland, Sewell & Associates, Inc. (Domestic Properties) |
| 99.2 | Report of Netherland, Sewell & Associates, Inc. (International Properties) |
| 101. | Interactive Data Files |
| 101.INS | XBRL Instance Document.* |
| 101.SCH | XBRL Taxonomy Schema Document.* |
| 101.CAL | XBRL Calculation Linkbase Document.* |
| 101.DEF | XBRL Definition Linkbase Document.* |
| 101.LAB | XBRL Label Linkbase Document.* |
| 101.PRE | XBRL Presentation Linkbase Document.* |
57
Table of Contents
Index to Financial Statements
| (a) | Filed as an exhibit to the Companys Registration Statement on Form S-3 filed with the Commission on July 15, 1998, and hereby incorporated by reference herein. |
| (b) | Filed as an exhibit to the Companys Form 10 (File No. 0-20928) filed on December 3, 1992, as amended by Amendment No. 1 on Form 8 on January 7, 1993, and by Amendment No. 2 on Form 8 on January 25, 1993, and hereby incorporated by reference herein. |
| (c) | Filed as an exhibit to the Companys Form 10-QSB for the quarterly period ended September 30, 1995, and hereby incorporated by reference herein. |
| (d) | Filed as an exhibit to the Companys Form 10-KSB for the annual period ended December 31, 1996, and hereby incorporated by reference herein. |
| (e) | Filed as an exhibit to the Companys Registration Statement Form S-8 filed with the Commission on August 18, 2001, and incorporated by reference herein. |
| (f) | Filed as an exhibit to the Companys Form 10-QSB for the quarterly period ended June 30, 2002, and hereby incorporated by reference herein. |
| (g) | Filed as an exhibit to Form10-KSB for the annual period ended December 31, 2004, and hereby incorporated by reference herein. |
| (h) | Filed as an exhibit to Form 10-K for the annual period ended December 31, 2005, and hereby incorporated by reference herein. |
| (i) | Filed as an exhibit to the Companys Registration Statement Form S-8 filed with the Commission on July 25, 2007 and hereby incorporated by reference herein. |
| (j) | Filed as an exhibit to Companys Report on Form 8-K filed with the Commission on December 12, 2007, and hereby incorporated by reference herein. |
| (k) | Filed as an exhibit to Companys Report on Form 8-K filed with the Commission on May 28, 2008, and hereby incorporated by reference herein. |
| (l) | Filed as an exhibit to Companys Report on Form 8-K filed with the Commission on November 7, 2006, and hereby incorporated by reference herein. |
| * | Pursuant to Rule 406T of Regulation S-T, these interactive data files are deemed not filed or part of a registration statement or prospectus for purposes of Sections 11 or 12 of the Securities Act of 1933 or Section 18 of the Securities Exchange Act of 1934 and otherwise are not subject to liability. |
58
Table of Contents
Index to Financial Statements
SIGNATURES
In accordance with Section 13 or 15(d) of the Exchange Act, the registrant caused this report to be signed on its behalf by the undersigned, thereunto duly authorized.
VAALCO ENERGY, INC.
(Registrant)
| By |
/s/ GREGORY R. HULLINGER |
|
| Gregory R. Hullinger Chief Financial Officer |
Dated March 14, 2013
In accordance with the Exchange Act, this report has been signed below on the 14th day of March, 2013, by the following persons on behalf of the registrant and in the capacities indicated.
| Signature |
Title |
|||
| By: |
/s/ ROBERT L. GERRY, III. Robert L. Gerry, III. |
Chairman of the Board, Chief Executive Officer and Director (Principal Executive Officer) |
||
| By: |
/s/ W. RUSSELL SCHEIRMAN W. Russell Scheirman |
President, Chief Operating Officer |
||
| By: |
/s/ GREGORY R. HULLINGER Gregory R. Hullinger |
Chief Financial Officer |
||
| By: |
/s/ ROBERT H. ALLEN Robert H. Allen |
Director |
||
| By: |
/s/ LUIGI CAFLISCH Luigi Caflisch |
Director |
||
| By: |
/s/ O. DONALD CHAPOTON O. Donald Chapoton |
Director |
||
| By: |
/s/ JOHN J. MYERS, JR. John J. Myers, Jr. |
Director |
||
| By: |
/s/ FREDERICK W. BRAZELTON Frederick W. Brazelton |
Director |
||
59
Table of Contents
Index to Financial Statements
VAALCO ENERGY, INC. AND SUBSIDIARIES
INDEX TO CONSOLIDATED FINANCIAL INFORMATION
| VAALCO ENERGY, INC. AND SUBSIDIARIES |
||||
| F-2 | ||||
| F-3 | ||||
| Statements of Consolidated Operations |
F-4 | |||
| Statements of Consolidated Equity |
F-5 | |||
| Statements of Consolidated Cash Flows |
F-6 | |||
| F-7 | ||||
F-1
Table of Contents
Index to Financial Statements
REPORT OF INDEPENDENT REGISTERED PUBLIC ACCOUNTING FIRM
To the Board of Directors and Stockholders of VAALCO Energy, Inc. and subsidiaries:
We have audited the accompanying consolidated balance sheets of VAALCO Energy, Inc. and subsidiaries (the Company) as of December 31, 2012 and 2011, and the related statements of consolidated operations, equity, and cash flows for each of the three years in the period ended December 31, 2012. These financial statements are the responsibility of the Companys management. Our responsibility is to express an opinion on these financial statements based on our audits.
We conducted our audits in accordance with the standards of the Public Company Accounting Oversight Board (United States). Those standards require that we plan and perform the audit to obtain reasonable assurance about whether the financial statements are free of material misstatement. An audit includes examining, on a test basis, evidence supporting the amounts and disclosures in the financial statements. An audit also includes assessing the accounting principles used and significant estimates made by management, as well as evaluating the overall financial statement presentation. We believe that our audits provide a reasonable basis for our opinion.
In our opinion, such consolidated financial statements present fairly, in all material respects, the financial position of VAALCO Energy, Inc. and subsidiaries as of December 31, 2012 and 2011, and the results of their operations and their cash flows for each of the three years in the period ended December 31, 2012, in conformity with accounting principles generally accepted in the United States of America.
We have also audited, in accordance with the standards of the Public Company Accounting Oversight Board (United States), the Companys internal control over financial reporting as of December 31, 2012, based on the criteria established in Internal ControlIntegrated Framework issued by the Committee of Sponsoring Organizations of the Treadway Commission, and our report dated March 14, 2013 expressed an unqualified opinion on the Companys internal control over financial reporting.
/s/ DELOITTE & TOUCHE LLP
Houston, Texas
March 14, 2013
F-2
Table of Contents
Index to Financial Statements
VAALCO ENERGY, INC. AND SUBSIDIARIES
CONSOLIDATED BALANCE SHEETS
(in thousands of dollars, except number of shares and par value amounts)
|
December 31, 2012 |
December 31, 2011 |
|||||||
| ASSETS |
||||||||
| Current assets: |
||||||||
| Cash and cash equivalents |
$ | 130,800 | $ | 137,139 | ||||
| Restricted cash |
1,257 | 1,314 | ||||||
| Receivables: |
||||||||
| Trade |
7,961 | 10,087 | ||||||
| Accounts with partners, net of allowance of $6.0 million in 2012 and $4.4 million in 2011 |
689 | 6,974 | ||||||
| Other |
4,463 | 4,239 | ||||||
| Crude oil inventory |
683 | 757 | ||||||
| Materials and supplies |
337 | 235 | ||||||
| Prepayments and other |
2,935 | 2,178 | ||||||
|
|
|
|
|
|||||
| Total current assets |
149,125 | 162,923 | ||||||
|
|
|
|
|
|||||
| Property and equipmentsuccessful efforts method: |
||||||||
| Wells, platforms and other production facilities |
188,208 | 178,653 | ||||||
| Undeveloped acreage |
28,657 | 25,344 | ||||||
| Work in progress |
38,137 | 20,703 | ||||||
| Equipment and other |
7,574 | 4,543 | ||||||
|
|
|
|
|
|||||
| 262,576 | 229,243 | |||||||
| Accumulated depreciation, depletion and amortization |
(155,968 | ) | (129,395 | ) | ||||
|
|
|
|
|
|||||
| Net property and equipment |
106,608 | 99,848 | ||||||
|
|
|
|
|
|||||
| Other assets: |
||||||||
| Deferred tax asset |
1,349 | 1,349 | ||||||
| Restricted cash |
10,874 | 10,895 | ||||||
|
|
|
|
|
|||||
| Total Assets |
$ | 267,956 | $ | 275,015 | ||||
|
|
|
|
|
|||||
| LIABILITIES AND EQUITY |
||||||||
| Current liabilities: |
||||||||
| Accounts payable and accrued liabilities |
30,326 | 24,677 | ||||||
| Accounts with partners |
14,737 | 413 | ||||||
|
|
|
|
|
|||||
| Total current liabilities |
$ | 45,063 | $ | 25,090 | ||||
|
|
|
|
|
|||||
| Asset retirement obligations |
10,368 | 14,528 | ||||||
| Other liabilities |
| 2,330 | ||||||
|
|
|
|
|
|||||
| Total liabilities |
55,431 | 41,948 | ||||||
|
|
|
|
|
|||||
| Commitments and contingencies (Note 6) |
||||||||
| VAALCO Energy Inc. shareholders equity: |
||||||||
| Common stock, $0.10 par value, 100,000,000 authorized shares, 63,135,772 and 62,376,563 shares issued with 5,257,638 and 5,257,638 shares in treasury at Dec. 31, 2012 and 2011, respectively |
6,314 | 6,238 | ||||||
| Additional paid-in capital |
48,816 | 66,122 | ||||||
| Retained earnings |
181,370 | 180,739 | ||||||
| Less treasury stock, at cost |
(23,975 | ) | (23,975 | ) | ||||
|
|
|
|
|
|||||
| Total VAALCO Energy Inc. shareholders equity |
212,525 | 229,124 | ||||||
| Noncontrolling interest |
| 3,943 | ||||||
|
|
|
|
|
|||||
| Total Equity |
212,525 | 233,067 | ||||||
|
|
|
|
|
|||||
| Total Liabilities and Equity |
$ | 267,956 | $ | 275,015 | ||||
|
|
|
|
|
|||||
See notes to consolidated financial statements.
F-3
Table of Contents
Index to Financial Statements
VAALCO ENERGY, INC. AND SUBSIDIARIES
STATEMENTS OF CONSOLIDATED OPERATIONS
(in thousands of dollars, except per share amounts)
| Year Ended December 31, | ||||||||||||
| 2012 | 2011 | 2010 | ||||||||||
| Revenues: |
||||||||||||
| Oil and gas sales |
$ | 195,287 | $ | 210,436 | $ | 134,472 | ||||||
|
|
|
|
|
|
|
|||||||
| Operating costs and expenses: |
||||||||||||
| Production expense |
26,724 | 26,731 | 22,112 | |||||||||
| Exploration expense |
41,037 | 5,708 | 6,813 | |||||||||
| Depreciation, depletion and amortization |
19,913 | 25,596 | 20,021 | |||||||||
| General and administrative expense |
11,779 | 10,417 | 7,403 | |||||||||
| Bad debt expenses |
1,621 | 4,448 | | |||||||||
| Impairment of proved properties |
7,620 | 4,975 | | |||||||||
|
|
|
|
|
|
|
|||||||
| Total operating costs and expenses |
108,694 | 77,875 | 56,349 | |||||||||
|
|
|
|
|
|
|
|||||||
| Operating income |
86,593 | 132,561 | 78,123 | |||||||||
| Other income (expense): |
||||||||||||
| Interest income |
145 | 184 | 151 | |||||||||
| Other, net |
414 | 1,285 | (627 | ) | ||||||||
|
|
|
|
|
|
|
|||||||
| Total other income (expense) |
559 | 1,469 | (476 | ) | ||||||||
|
|
|
|
|
|
|
|||||||
| Income before income taxes |
87,152 | 134,030 | 77,647 | |||||||||
| Income tax expense |
81,813 | 93,468 | 35,260 | |||||||||
|
|
|
|
|
|
|
|||||||
| Net income |
5,339 | 40,562 | 42,387 | |||||||||
| Less net income attributable to noncontrolling interest |
(4,708 | ) | (6,417 | ) | (5,047 | ) | ||||||
|
|
|
|
|
|
|
|||||||
| Net income attributable to VAALCO Energy, Inc. |
$ | 631 | $ | 34,145 | $ | 37,340 | ||||||
|
|
|
|
|
|
|
|||||||
| Basic net income per share attributable to VAALCO Energy, Inc. common shareholders |
$ | 0.01 | $ | 0.60 | $ | 0.66 | ||||||
|
|
|
|
|
|
|
|||||||
| Diluted net income per share attributable to VAALCO Energy, Inc. common shareholders |
$ | 0.01 | $ | 0.59 | $ | 0.65 | ||||||
|
|
|
|
|
|
|
|||||||
| Basic weighted average shares outstanding |
57,673 | 57,048 | 56,466 | |||||||||
|
|
|
|
|
|
|
|||||||
| Diluted weighted average shares outstanding |
58,832 | 57,973 | 57,038 | |||||||||
|
|
|
|
|
|
|
|||||||
See notes to consolidated financial statements
F-4
Table of Contents
Index to Financial Statements
VAALCO ENERGY, INC AND SUBSIDIARIES
STATEMENTS OF CONSOLIDATED EQUITY
(in thousands of dollars)
| VAALCO ENERGY, Inc. Shareholders | ||||||||||||||||||||||||
| Common Stock |
Additional Paid-In Capital |
Retained Earnings |
Treasury Stock |
Noncontrolling Interest |
Total | |||||||||||||||||||
| Balance at January 1, 2010 |
$ | 6,157 | $ | 57,550 | $ | 109,249 | $ | (21,515 | ) | $ | 5,664 | $ | 157,105 | |||||||||||
| Stock issuance |
125 | 4,614 | | (4,150 | ) | | 589 | |||||||||||||||||
| Stock based compensation |
| 2,150 | | | | 2,150 | ||||||||||||||||||
| Net income (loss) |
| | 37,340 | | 5,047 | 42,387 | ||||||||||||||||||
| Redemption of rights agreement |
| | 5 | | | 5 | ||||||||||||||||||
| Distribution to noncontrolling interest |
| | | | (5,993 | ) | (5,993 | ) | ||||||||||||||||
|
|
|
|
|
|
|
|
|
|
|
|
|
|||||||||||||
| Balance at December 31, 2010 |
$ | 6,282 | $ | 64,314 | $ | 146,594 | $ | (25,665 | ) | $ | 4,718 | $ | 196,243 | |||||||||||
|
|
|
|
|
|
|
|
|
|
|
|
|
|||||||||||||
| Stock issuance |
30 | 1,207 | | | | 1,237 | ||||||||||||||||||
| Stock based compensation |
| 2,217 | | | | 2,217 | ||||||||||||||||||
| Constructive retirement of treasury stock |
(74 | ) | (1,616 | ) | | 1,690 | | | ||||||||||||||||
| Net income |
| | 34,145 | | 6,417 | 40,562 | ||||||||||||||||||
| Distribution to noncontrolling interest |
| | | | (7,192 | ) | (7,192 | ) | ||||||||||||||||
|
|
|
|
|
|
|
|
|
|
|
|
|
|||||||||||||
| Balance at December 31, 2011 |
$ | 6,238 | $ | 66,122 | $ | 180,739 | $ | (23,975 | ) | $ | 3,943 | $ | 233,067 | |||||||||||
|
|
|
|
|
|
|
|
|
|
|
|
|
|||||||||||||
| Stock issuance |
76 | 3,432 | | | | 3,508 | ||||||||||||||||||
| Stock based compensation |
| 2,406 | | | | 2,406 | ||||||||||||||||||
| Net income |
| | 631 | | 4,708 | 5,339 | ||||||||||||||||||
| Distribution to noncontrolling interest |
| | | | (5,595 | ) | (5,595 | ) | ||||||||||||||||
| Acquisition of noncontrolling interest |
| (23,144 | ) | | | (3,056 | ) | (26,200 | ) | |||||||||||||||
|
|
|
|
|
|
|
|
|
|
|
|
|
|||||||||||||
| Balance at December 31, 2012 |
$ | 6,314 | $ | 48,816 | $ | 181,370 | $ | (23,975 | ) | $ | | $ | 212,525 | |||||||||||
|
|
|
|
|
|
|
|
|
|
|
|
|
|||||||||||||
See notes to consolidated financial statements
F-5
Table of Contents
Index to Financial Statements
VAALCO ENERGY, INC. AND SUBSIDIARIES
STATEMENTS OF CONSOLIDATED CASH FLOWS
(in thousands of dollars)
| Year Ended December 31, | ||||||||||||
| 2012 | 2011 | 2010 | ||||||||||
| CASH FLOWS FROM OPERATING ACTIVITIES |
||||||||||||
| Net income |
$ | 5,339 | $ | 40,562 | $ | 42,387 | ||||||
| Adjustments to reconcile net income to net cash provided by operating activities |
||||||||||||
| Depreciation, depletion and amortization |
19,913 | 25,596 | 20,021 | |||||||||
| Unrealized foreign exchange (gain) loss |
(245 | ) | 25 | (595 | ) | |||||||
| Dry hole costs |
37,289 | 60 | 2,609 | |||||||||
| Stock based compensation |
2,406 | 2,217 | 1,895 | |||||||||
| Bad debt provision |
1,621 | 4,448 | | |||||||||
| Impairment loss |
7,620 | 4,975 | | |||||||||
| Gain on disposal of assets |
| 4 | | |||||||||
| Change in operating assets and liabilities: |
||||||||||||
| Trade receivables |
2,126 | 3,981 | (5,893 | ) | ||||||||
| Accounts with partners |
18,988 | 5,171 | (2,622 | ) | ||||||||
| Other receivables |
(199 | ) | 5,560 | (4,557 | ) | |||||||
| Crude oil inventory |
(71 | ) | 176 | (262 | ) | |||||||
| Materials and supplies |
(102 | ) | 266 | (341 | ) | |||||||
| Other long term assets |
| | 502 | |||||||||
| Prepayments and other |
(766 | ) | (886 | ) | (301 | ) | ||||||
| Accounts payable and other liabilities |
39 | (2,570 | ) | (7,328 | ) | |||||||
|
|
|
|
|
|
|
|||||||
| Net cash provided by operating activities |
93,958 | 89,585 | 45,515 | |||||||||
|
|
|
|
|
|
|
|||||||
| CASH FLOWS FROM INVESTING ACTIVITIES |
||||||||||||
| Decrease in restricted cash |
78 | 3,597 | 639 | |||||||||
| Property and equipment expenditures |
(71,915 | ) | (31,973 | ) | (40,012 | ) | ||||||
|
|
|
|
|
|
|
|||||||
| Net cash used in investing activities |
(71,837 | ) | (28,376 | ) | (39,373 | ) | ||||||
|
|
|
|
|
|
|
|||||||
| CASH FLOWS FROM FINANCING ACTIVITIES |
||||||||||||
| Proceeds from the issuance of common stock |
3,335 | 1,888 | 510 | |||||||||
| Redemption of rights agreement |
| | 5 | |||||||||
| Distribution to noncontrolling interest |
(5,595 | ) | (7,192 | ) | (5,993 | ) | ||||||
| Acquisition of noncontrolling interest |
(26,200 | ) | | | ||||||||
|
|
|
|
|
|
|
|||||||
| Net cash used in financing activities |
(28,460 | ) | (5,304 | ) | (5,478 | ) | ||||||
|
|
|
|
|
|
|
|||||||
| NET CHANGE IN CASH AND CASH EQUIVALENTS |
(6,339 | ) | 55,905 | 664 | ||||||||
| CASH AND CASH EQUIVALENTS AT BEGINNING OF PERIOD |
137,139 | 81,234 | 80,570 | |||||||||
|
|
|
|
|
|
|
|||||||
| CASH AND CASH EQUIVALENTS AT END OF PERIOD |
$ | 130,800 | $ | 137,139 | $ | 81,234 | ||||||
|
|
|
|
|
|
|
|||||||
| Supplemental disclosure of cash flow information |
||||||||||||
| Cash paid for Income taxes |
$ | 83,306 | $ | 92,275 | $ | 35,777 | ||||||
|
|
|
|
|
|
|
|||||||
| Supplemental disclosure of non cash investing and financing activities |
||||||||||||
| Property and equipment additions incurred during the period but not paid at period end |
$ | 9,814 | $ | 6,450 | $ | 5,478 | ||||||
|
|
|
|
|
|
|
|||||||
| Receivable from employees for stock option exercise |
$ | 173 | $ | | $ | 651 | ||||||
|
|
|
|
|
|
|
|||||||
See notes to consolidated financial statements.
F-6
Table of Contents
Index to Financial Statements
VAALCO ENERGY, INC AND SUBSIDIARIES
NOTES TO THE CONSOLIDATED FINANCIAL STATEMENTS
| 1. | ORGANIZATION |
VAALCO Energy, Inc., a Delaware corporation, is a Houston-based independent energy company principally engaged in the acquisition, exploration, development and production of crude oil and natural gas. As used herein, the terms Company and VAALCO mean VAALCO Energy, Inc. and its subsidiaries, unless the context otherwise requires. VAALCO owns producing properties and conducts exploration activities as operator of consortiums internationally in Gabon and Angola and has conducted exploration activities as a non-operator in the British North Sea and Equatorial Guinea, West Africa. Domestically, the Company has interests in Texas, Montana, South Dakota, Alabama, and the Louisiana Gulf Coast area.
VAALCOs international subsidiaries are VAALCO Gabon (Etame), Inc., VAALCO Production (Gabon), Inc., VAALCO Angola (Kwanza), Inc., VAALCO UK (North Sea), Ltd., VAALCO International, Inc., VAALCO Energy (EG), Inc. and VAALCO Energy Mauritius (EG) Limited. VAALCO Energy (USA), Inc. holds interests in properties located in the United States.
| 2. | SUMMARY OF SIGNIFICANT ACCOUNTING POLICIES |
Principles of ConsolidationThe accompanying consolidated financial statements include the accounts of the Company and its wholly owned subsidiaries. The portion of the income and net assets applicable to the non-controlling interest in the majority-owned operations of the Companys Gabon subsidiary has been reflected as noncontrolling interest. All intercompany transactions within the consolidated group have been eliminated in consolidation.
In December 2012, the Company acquired the noncontrolling interest in VAALCO International, Inc., for $26.2 million, with an effective date of October 1, 2012. Prior to the acquisition, the noncontrolling interest owned 9.99% of the issued and outstanding common stock of VAALCO International, Inc., a Delaware corporation of which VAALCO Gabon Etame, Inc. is the wholly owned subsidiary.
Cash and Cash EquivalentsFor purposes of the statements of consolidated cash flows, the Company considers all highly liquid debt instruments purchased with an original maturity of three months or less to be cash and cash equivalents.
Restricted CashRestricted cash includes cash that is contractually restricted. Restricted cash is classified as a current or non-current asset based on its designated purpose. Current amounts at December 31, 2012 and 2011 each include an escrow account representing the Companys bank guarantees for customs clearance in Gabon ($1.3 million). Long term amounts at December 31, 2012 and 2011 each include the Companys charter payment escrow for the Floating Production Storage and Offloading tanker (FPSO) in Gabon ($0.8 million), funds restricted to secure the Companys drilling obligation in Block 5 in Angola ($10.0 million), and funds restricted for the abandonment of certain Gulf of Mexico properties ($44,000).
The Company invests restricted and excess cash in certificates of deposit and commercial paper issued by banks with maturities typically not exceeding 90 days.
InventoryMaterials and supplies are valued at the lower of cost, determined by the weighted-average method, or market. Crude oil inventories are carried at the lower of cost or market and represent the Companys share of crude oil produced and stored on the FPSO, but unsold. Inventory cost represents the production expenses including depletion.
F-7
Table of Contents
Index to Financial Statements
VAALCO ENERGY, INC AND SUBSIDIARIES
NOTES TO THE CONSOLIDATED FINANCIAL STATEMENTS(Continued)
Income TaxesVAALCO accounts for income taxes under an asset and liability approach that recognizes deferred income tax assets and liabilities for the estimated future tax consequences of differences between the financial statements and tax bases of assets and liabilities. Valuation allowances are provided against deferred tax assets that are not likely to be realized.
Property and EquipmentThe Company follows the successful efforts method of accounting for exploration and development costs. Under this method, exploration costs, other than the cost of exploratory wells, are charged to expense as incurred. Exploratory well costs are initially capitalized until a determination as to whether proved reserves have been discovered. If an exploratory well is deemed to not have found proved reserves, the associated costs are expensed at that time. Other exploration costs, including geological and geophysical expenses applicable to undeveloped leasehold, leasehold expiration costs and delay rentals are expensed as incurred. All development costs, including developmental dry hole costs, are capitalized.
The Company records the fair value of a liability for an asset retirement obligation in the period in which it is incurred by capitalizing the corresponding cost as part of the carrying amount of the long-lived assets.
The Company reviews its oil and gas properties for impairment whenever events or changes in circumstances indicate that the carrying amount of such properties may not be recoverable. When it is determined that an oil and gas propertys estimated future net cash flows will not be sufficient to recover its carrying amount, an impairment charge must be recorded to reduce the carrying amount of the asset to its estimated fair value. Provisions for impairment of undeveloped oil and gas leases are based on periodic evaluations and other factors.
Depletion of wells, platforms, and other production facilities are calculated on a field basis under the unit-of-production method based upon estimates of proved developed producing reserves. Depletion of developed leasehold acquisition costs are provided on a field basis under the unit-of-production method based upon estimates of proved reserves. Undeveloped leasehold acquisition costs are not subject to depletion, but are subject to impairment testing. Provision for depreciation of other property is made primarily on a straight-line basis over the estimated useful life of the property. The annual rates of depreciation are as follows:
| Office and miscellaneous equipment: |
3-5 years | |||
| Leasehold improvements: |
8-12 years |
Foreign Exchange TransactionsFor financial reporting purposes, the subsidiaries use the United States Dollar as their functional currency. Gains and losses on foreign currency transactions are included in income currently. The Company recognized gains on foreign currency transactions of $0.4 million and $1.0 million, and losses of $0.6 million in 2012, 2011 and 2010, respectively.
Accounts With PartnersAccounts with partners represent cash calls due or excess cash calls paid by the partners for exploration, development and production expenditures made by VAALCO Gabon (Etame), Inc. and VAALCO Angola (Kwanza), Inc., and VAALCO (USA), Inc.
Bad DebtOn a quarterly basis, the Company evaluates its accounts receivable balances to confirm collectability. Where collectability is in doubt, the Company records an allowance against the accounts receivable balance with a corresponding charge to net income as bad debt expense. Nearly all of the Companys accounts receivable balances are with its joint venture partners and purchasers of its oil, natural gas and natural gas liquids. Collection efforts, including remedies provided for in the contracts, are pursued to collect overdue amounts owed to the Company.
F-8
Table of Contents
Index to Financial Statements
VAALCO ENERGY, INC AND SUBSIDIARIES
NOTES TO THE CONSOLIDATED FINANCIAL STATEMENTS(Continued)
During 2012 and 2011, the Company recorded a bad debt allowance of $1.6 million and $4.4 million, respectively, related to the uncertainty in collecting its joint venture receivable in Angola. The table below shows a rollforward analysis of the allowance against the partner accounts receivable balance: (in thousands)
| Description |
Balance at Beginning of Period |
Charged to Costs and Expenses |
Balance at End of Period |
|||||||||
| Allowance for Doubtfull Accounts |
||||||||||||
| Year Ended December 31, 2012 |
(4,448 | ) | (1,621 | ) | (6,069 | ) | ||||||
| Year Ended December 31, 2011 |
| (4,448 | ) | (4,448 | ) | |||||||
Revenue RecognitionThe Company recognizes revenues from crude oil and natural gas sales upon delivery to the buyer.
Stock Based CompensationThe Company measures the cost of employee services received in exchange for an award of equity instruments based on the fair value of the award on the date of the grant. Grant date fair value is estimated using an option-pricing model which is consistent with the terms of the award. Such cost is recognized over the period during which an employee is required to provide service in exchange for the award (which is usually the vesting period). The Company estimates the number of instruments that will ultimately be issued, rather than accounting for forfeitures as they occur.
Fair Value of Financial InstrumentsThe Companys financial instruments consist primarily of cash, restricted cash, trade receivables and trade payables. The book values of cash, restricted cash, trade receivables, and trade payables are representative of their respective fair values due to the short-term maturity of these instruments.
Fair ValueFair value is defined as the price that would be received to sell an asset or the price paid to transfer a liability in an orderly transaction between market participants at the measurement date. Inputs used in determining fair value are characterized according to a hierarchy that prioritizes those inputs based on the degree to which they are observable. The three input levels of the fair-value hierarchy are as follows:
Level 1Inputs represent quoted prices in active markets for identical assets or liabilities (for example, exchange-traded commodity derivatives).
Level 2Inputs other than quoted prices included within Level 1 that are observable for the asset or liability, either directly or indirectly (for example, quoted market prices for similar assets or liabilities in active markets or quoted market prices for identical assets or liabilities in markets not considered to be active, inputs other than quoted prices that are observable for the asset or liability, or market-corroborated inputs).
Level 3Inputs that are not observable from objective sources, such as the Companys internally developed assumptions used in pricing an asset or liability (for example, an estimate of future cash flows used in the Companys internally developed present value of future cash flows model that underlies the fair-value measurement).
Risks and UncertaintiesThe Companys interests are located overseas in onshore and offshore Gabon, offshore in Angola and Equatorial Guinea, and domestically in Texas, Montana, Alabama, South Dakota, and the Louisiana Gulf Coast area.
Substantially all of the Companys oil and gas is sold at the well head at posted or indexed prices under short-term contracts, as is customary in the industry.
F-9
Table of Contents
Index to Financial Statements
VAALCO ENERGY, INC AND SUBSIDIARIES
NOTES TO THE CONSOLIDATED FINANCIAL STATEMENTS(Continued)
In Gabon, the Company sold oil under contracts with Mercuria Trading NV (Mercuria) which ran through calendar years 2011 and 2012. For the 2013 calendar year, the Company will also sell its oil under a contract with Mercuria. While the loss of Mercuria as a buyer might have a material effect on the Company in the short term, management believes that the Company would be able to obtain other customers for its crude oil.
Domestic operated production in Texas is sold via two contracts, one for oil and one for gas and natural gas liquids. The Company has access to several alternative buyers for oil, gas, and natural gas liquids domestically.
Use of Estimates in Financial Statement PreparationThe preparation of financial statements in conformity with generally accepted accounting principles requires estimates and assumptions that affect the reported amounts of assets and liabilities as well as certain disclosures. The Companys consolidated financial statements include amounts that are based on managements best estimates and judgments. Actual results could differ from those estimates.
Estimates of oil and gas reserves used in the consolidated financial statements to estimate depletion expense and impairment charges require extensive judgments and are generally less precise than other estimates made in connection with financial disclosures. The Company considers its estimates to be reasonable; however, due to inherent uncertainties and the limited nature of data, estimates are imprecise and subject to change over time as additional information become available.
Asset Retirement Obligations (ARO)The Company has significant obligations to remove tangible equipment and restore land or seabed at the end of oil and gas production operations. The Companys removal and restoration obligations are primarily associated with plugging and abandoning wells, removing and disposing of all or a portion of offshore oil and gas platforms, and capping pipelines. Estimating the future restoration and removal costs is difficult and requires management to make estimates and judgments. Asset removal technologies and costs are constantly changing, as are regulatory, political, environmental, safety, and public relations considerations.
ARO associated with retiring tangible long-lived assets is recognized as a liability in the period in which the legal obligation is incurred and becomes determinable. The liability is offset by a corresponding increase in the underlying asset. The ARO liability reflects the estimated present value of the amount of dismantlement, removal, site reclamation, and similar activities associated with The Companys oil and gas properties. The Company utilizes current retirement costs to estimate the expected cash outflows for retirement obligations. Inherent in the present value calculation are numerous assumptions and judgments including the ultimate settlement amounts, inflation factors, credit-adjusted discount rates, timing of settlement, and changes in the legal, regulatory, environmental, and political environments. To the extent future revisions to these assumptions impact the present value of the existing ARO liability, a corresponding adjustment is made to the oil and gas property balance. Accretion expense is recognized over time as the discounted liability is accreted to its expected settlement value.
Subsequent EventsThe Company has evaluated subsequent events through the date the financial statements were issued.
| 3. | STOCK BASED COMPENSATION |
Stock options are granted under the Companys long-term incentive plan and have an exercise price that may not be less than the fair market value of the underlying shares on the date of grant. In general, stock options granted will become exercisable over a period determined by the Compensation Committee which in the past has been a five year life, with the options vesting over a three year period. A portion of the stock options granted in
F-10
Table of Contents
Index to Financial Statements
VAALCO ENERGY, INC AND SUBSIDIARIES
NOTES TO THE CONSOLIDATED FINANCIAL STATEMENTS(Continued)
March 2012, 2011, and 2010 were vested immediately with the others vesting over a three year period. In addition, stock options will become exercisable upon a change in control, unless provided otherwise by the Compensation Committee. At December 31, 2012, there were 3,363,446 shares subject to options authorized but not granted.
For the years ended December 31, 2012, 2011 and 2010, the Company recognized non-cash compensation expense of $2.4 million, $2.2 million and $1.8 million, respectively. These amounts were recorded as general and administrative expense. Because the Company does not pay significant United States taxes, no amounts were recorded for tax benefits.
A summary of the stock option activity for the year ended December 31, 2012 is provided below:
| Number of Shares Underlying Options (in thousands) |
Weighted Average Exercise Price Per Share |
Weighted Average Remaining Contractual Term |
Aggregate Intrinsic Value (in millions) |
|||||||||||||
| Outstanding at beginning of period |
3,805 | $ | 5.10 | 2.94 | ||||||||||||
| Granted |
1,024 | $ | 8.81 | 4.21 | ||||||||||||
| Exercised |
(759 | ) | $ | 4.62 | 1.29 | |||||||||||
| Forfeited |
(5 | ) | $ | 8.33 | 3.95 | |||||||||||
|
|
|
|
|
|
|
|||||||||||
| Outstanding at end of period |
4,065 | $ | 6.12 | 2.65 | $ | 8.62 | ||||||||||
|
|
|
|
|
|
|
|
|
|||||||||
| Vestedend of period |
3,153 | $ | 5.53 | 2.31 | $ | 8.26 | ||||||||||
|
|
|
|
|
|
|
|
|
|||||||||
| Vested and expected to vestend of period |
3,781 | $ | 6.12 | 2.65 | $ | 8.51 | ||||||||||
|
|
|
|
|
|
|
|
|
|||||||||
The intrinsic value of a stock option is the amount by which the current market value of the underlying stock exceeds the exercise price of the option.
As of December 31, 2012, unrecognized compensation costs totaled $1.1 million. The expense is expected to be recognized over a weighted average period of 1.1 years.
A summary of the values of options granted and exercised for each of the years ending December 31, 2012, 2011 and 2010 is provided below:
| 2012 | 2011 | 2010 | ||||||||||
| Options granted(thousands) |
1,024 | 1,169 | 1,565 | |||||||||
| Weighted average grant date fair value($/share) |
$ | 3.49 | $ | 2.09 | $ | 1.61 | ||||||
| Weighted average exercise price($/share) |
$ | 4.62 | $ | 4.12 | $ | 4.28 | ||||||
| Options exercised (thousands) |
759 | 302 | 1,014 | |||||||||
| Total intrinsic value of options exercised($thousands) |
$ | 3,267 | $ | 859 | $ | 2,413 | ||||||
The Company received cash proceeds of $3.3 million, $1.9 million and $0.5 million from issuance of stock related to options exercised in 2012, 2011 and 2010, respectively.
During the year ended December 31, 2010, 672,300 options were exercised on a cashless basis, resulting in 120,695 shares being issued to employees and 551,605 shares being added to treasury stock.
F-11
Table of Contents
Index to Financial Statements
VAALCO ENERGY, INC AND SUBSIDIARIES
NOTES TO THE CONSOLIDATED FINANCIAL STATEMENTS(Continued)
The valuation of the options granted is based upon a Black Scholes model. The table below summarizes the assumptions used to value the options issued in 2012 and 2011.
| Year |
Options Issued (in thousands) |
Weighted Avg. Volatility |
Expected Term |
Risk Free Interest Rate |
Expected Dividend Yield |
|||||||||||||||
| 2012 |
1,024 | 65 | % | 2.5 years | 0.5 | % | 0 | % | ||||||||||||
| 2011 |
1,169 | 47 | % | 2.5 years | 0.8 | % | 0 | % | ||||||||||||
| 2010 |
1,565 | 58 | % | 2.5 years | 2.6 | % | 0 | % | ||||||||||||
The Company has no set policy for sourcing shares for options grants. Historically the shares issued under options grants have been new shares.
| 4. | STOCKHOLDERS EQUITY AND EARNINGS PER SHARE |
The Company is authorized to issue up to 100 million shares of common stock. Basic earnings per share (EPS) is calculated using the average number of shares of common stock outstanding during each period. Diluted EPS assumes the exercise of all stock options having exercise prices less than the average market price of the common stock using the treasury stock method. A reconciliation of diluted shares consists of the following:
| Year Ended December 31, | ||||||||||||
| Item |
2012 | 2011 | 2010 | |||||||||
| Basic weighted average common stock issued and outstanding |
57,673,342 | 57,047,531 | 56,465,800 | |||||||||
| Dilutive options |
1,158,717 | 925,050 | 572,253 | |||||||||
|
|
|
|
|
|
|
|||||||
| Total diluted shares |
58,832,059 | 57,972,581 | 57,038,053 | |||||||||
|
|
|
|
|
|
|
|||||||
A total of 1,018,900, 1,169,064, and 1,420,940 shares under option were not included because they were anti-dilutive during the years ended December 31, 2012, 2011 and 2010, respectively.
On September 14, 2007, the Board of Directors of the Company adopted a Rights Agreement dated as of September 14, 2007, between the Company and the Registrar and Transfer agent of the Company, as Rights Agent. Ratification of the rights plan required the affirmative vote of at least a majority vote of shares entitled to vote at the June 3, 2009 Annual Meeting. Stockholders did not approve the ratification. The Rights Agreement was redeemed at the rate of 1/10th of $0.01 per share and paid to stockholders at a cost to the Company of approximately $67,000 in 2009. In 2010, the Company received $5,000 for its share of the redemption held as treasury stock.
| 5. | INCOME TAXES |
The Company and its domestic subsidiaries file a consolidated United States income tax return. Certain subsidiaries operations are also subject to foreign income taxes. Provision for income taxes consists of the following:
| (in thousands) | Year Ended December 31, | |||||||||||
| 2012 | 2011 | 2010 | ||||||||||
| U.S. Federal: |
||||||||||||
| Current |
$ | | $ | | $ | | ||||||
| Deferred |
| | | |||||||||
| Foreign: |
||||||||||||
| Current |
81,813 | 93,468 | 35,260 | |||||||||
| Deferred |
| | | |||||||||
|
|
|
|
|
|
|
|||||||
| Total |
$ | 81,813 | $ | 93,468 | $ | 35,260 | ||||||
|
|
|
|
|
|
|
|||||||
F-12
Table of Contents
Index to Financial Statements
VAALCO ENERGY, INC AND SUBSIDIARIES
NOTES TO THE CONSOLIDATED FINANCIAL STATEMENTS(Continued)
The primary differences between the financial statement and tax bases of assets and liabilities at December 31, 2012 and 2011 are as follows: (In thousands)
| 2012 | 2011 | |||||||
| Deferred Tax Assets: |
||||||||
| Basis difference in fixed assets |
$ | 30,619 | $ | 23,821 | ||||
| Foreign tax credit carry forward |
23,836 | 9,447 | ||||||
| Alternative minimum tax credit carryover |
1,349 | 1,349 | ||||||
| Foreign net operating losses |
38,782 | 35,766 | ||||||
| Asset retirement obligations |
3,629 | 5,322 | ||||||
| Other |
2,731 | 1,566 | ||||||
|
|
|
|
|
|||||
| $ | 100,946 | $ | 77,271 | |||||
| Valuation allowance |
(99,597 | ) | (75,922 | ) | ||||
|
|
|
|
|
|||||
| Total deferred tax asset |
$ | 1,349 | $ | 1,349 | ||||
|
|
|
|
|
|||||
Subsequent to the issuance of the Companys consolidated financial statements for the year ended December 31, 2011, management determined that certain income tax amounts disclosed in the 2011 tax footnote were not properly stated. The errors were primarily attributed to the calculation of foreign tax credits and foreign net operating losses. This correction in the disclosure is offset by an equal adjustment to our valuation allowance with no impact to the consolidated financial statements. As a result of these corrections to the deferred tax assets, the previously presented disclosure for uncertain tax benefits under ASC 740-10 was no longer applicable.
The Companys unused foreign tax credit will start to expire between the years 2013 and 2021. The alternative minimum tax credits do not expire, and foreign net operating losses (NOL) are not subject to expiry dates. The NOL for the Companys UK subsidiary can be carried forward indefinitely, while the NOLs for the Companys Gabon and Angola subsidiaries are included in the respective subsidiaries cost oil accounts, which will be offset against future taxable revenues. Management assesses the available positive and negative evidence to estimate if existing deferred tax assets will be utilized. The Company does not anticipate utilization of the foreign tax credits prior to expiration nor does the Company expect to generate sufficient taxable income to utilize other deferred tax assets. On the basis of this evaluation, a valuation allowance of $99.6 million and $75.9 million has been recorded as of December 31, 2012 and 2011, respectively, to reduce the deferred tax asset to the amount that is more likely than not to be realized.
Pretax income (loss) is comprised of the following:
| (in thousands) | Year Ended December 31, | |||||||||||
| 2012 | 2011 | 2010 | ||||||||||
| United States |
($ | 56,979 | ) | ($ | 16,282 | ) | ($ | 4,129 | ) | |||
| Foreign |
144,131 | 150,312 | 81,776 | |||||||||
|
|
|
|
|
|
|
|||||||
| $ | 87,152 | $ | 134,030 | $ | 77,647 | |||||||
|
|
|
|
|
|
|
|||||||
F-13
Table of Contents
Index to Financial Statements
VAALCO ENERGY, INC AND SUBSIDIARIES
NOTES TO THE CONSOLIDATED FINANCIAL STATEMENTS(Continued)
The statutory rate reconciliation is as follows:
| (In Thousands) | Year Ended December 31, | |||||||||||
| 2012 | 2011 | 2010 | ||||||||||
| Tax Provision Computed at Statutory Rate |
30,503 | $ | 46,911 | $ | 27,176 | |||||||
| Foreign taxes not offset in U.S. by foreign tax credits |
25,266 | 28,414 | 8,377 | |||||||||
| Permanent Differences |
2,370 | | | |||||||||
| Rate Differential Items |
| (2,889 | ) | | ||||||||
| Increase/(Decrease) in Valuation Allowance |
23,675 | 22,038 | (293 | ) | ||||||||
| Other |
(0 | ) | (1,006 | ) | | |||||||
|
|
|
|
|
|
|
|||||||
| Total Tax Expense |
$ | 81,813 | $ | 93,468 | $ | 35,260 | ||||||
|
|
|
|
|
|
|
|||||||
At December 31, 2012, the Company was subject to foreign and United States federal taxes only, with no allocations made to state and local taxes.
The following table summarizes the tax years that remain subject to examination by major tax jurisdictions:
| United States |
2006-2012 | |||
| Gabon |
2007-2012 |
| 6. | COMMITMENTS AND CONTINGENCIES |
FPSO Charter
In October 2012, the Company entered into an amendment with the owner of the FPSO chartered for the Etame field to extend the contract until September 2020. In connection with the charter of the FPSO, the Company, as operator of the Etame field, guaranteed the charter payments through the same period. The charter continues for two years beyond that period unless one years prior notice is given to the owner of the FPSO. The Company obtained several guarantees from its partners for their share of the charter payment. The Companys share of the charter payment is 28.1%. The Company believes the need for performance under the charter guarantee is remote. The estimated obligations for the annual charter payment and the Companys share of the charter payments through the end of the charter are as follows: (in thousands)
| Year |
Full Charter Payment | Company Share | ||||||
| 2013 |
$ | 24,444 | $ | 6,862 | ||||
| 2014 |
25,843 | 7,255 | ||||||
| 2015 |
25,843 | 7,255 | ||||||
| 2016 |
25,914 | 7,275 | ||||||
| 2017 |
25,843 | 7,255 | ||||||
| Thereafter |
77,600 | 21,785 | ||||||
|
|
|
|
|
|||||
| Total |
$ | 205,487 | $ | 57,687 | ||||
|
|
|
|
|
|||||
The Company has recorded a liability of $1.2 million and $0.4 million at December 31, 2012 and 2011, respectively, representing the guarantees fair value.
The Companys share of charter expense, including a $0.93 per Bbl charter fee for production up to 20,000 BOPD and a $2.50 per Bbl charter fee for those Bbls produced in excess of 20,000 BOPD, was $9.7 million, $7.3 million and $7.8 million for the years ending December 31, 2012, 2011 and 2010, respectively.
F-14
Table of Contents
Index to Financial Statements
VAALCO ENERGY, INC AND SUBSIDIARIES
NOTES TO THE CONSOLIDATED FINANCIAL STATEMENTS(Continued)
Other Lease Obligations
In addition to the FPSO, the Company has operating lease obligations for rentals as follows: (in thousands)
| Year |
Gross Obligation | Company Share | ||||||
| 2013 |
$ | 8,163 | $ | 2,708 | ||||
| 2014 |
5,866 | 2,017 | ||||||
| 2015 |
5,778 | 1,936 | ||||||
| 2016 |
3,962 | 1,422 | ||||||
| 2017 |
434 | 434 | ||||||
| Thereafter |
217 | 217 | ||||||
|
|
|
|
|
|||||
| Total |
$ | 24,420 | $ | 8,734 | ||||
|
|
|
|
|
|||||
The 2013 lease obligation amounts are significantly higher than amounts for years beyond 2013 due to short term contracts for helicopter and marine vessels supporting the offshore Gabon operations.
The Company incurred rent expense of $4.4 million, $3.6 million and $6.0 million under operating leases for the years December 31, 2012, 2011 and 2010, respectively.
Gabon Obligation
Under the terms of the Etame Production Sharing Contract, the consortium is required to provide to the local government refinery a volume of crude at a 25% discount to market price (the Gabon Obligation). The volume required to be furnished is the amount of the Etame Marin block production divided by the total Gabon production times the volume of oil refined by the refinery per year. In 2012, the Company paid $3.7 million for its share of the 2011 obligation. In 2011, the Company paid $2.8 million for its share of the 2010 obligation. In 2010, the Company paid $1.3 million for its share of the 2009 obligation. The Company accrues an amount for the Gabon Obligation based on managements best estimate of the volume of crude required, because the refinery does not publish its throughput figures. The amount accrued at December 31, 2012, for the Companys share of the 2012 obligation is $3.6 million.
Offshore Gabon
In addition to the contractual obligations described above, the Company entered into a sixth exploration period extension during 2009 and is required to spend $5.3 million for its share of two exploration wells and to acquire and process 150 square kilometers of 3-D seismic on the Etame Marin block by July 2014. One of the two exploration commitment wells was drilled in 2010 on the Omangou prospect at a cost of $8.6 million ($2.6 million net to the Company). The seismic obligation was met with the acquisition of 223 square kilometers of 3-D seismic in 2012. The remaining obligation is the drilling of one exploration well which is scheduled to drilled in mid-2013.
As part of securing the second ten year production license with the government of Gabon, the Company agreed in principle to a cash funding arrangement for the eventual abandonment of the offshore wells, platforms and facilities. The agreement is not yet finalized, but calls for annual funding for the next seven years at 12.14% of the total abandonment estimate per year and 5.0% per year for the last three years of the production license. The amounts paid will be reimbursed through the cost account and are non-refundable to the Company. The funding is expected to begin in 2013 after the agreement is finalized. The abandonment estimate for this purpose is estimated to be approximately $9.7 million net to the Company on an undiscounted basis. As in prior periods,
F-15
Table of Contents
Index to Financial Statements
VAALCO ENERGY, INC AND SUBSIDIARIES
NOTES TO THE CONSOLIDATED FINANCIAL STATEMENTS(Continued)
the obligation for abandonment of the Gabon offshore facilities is included in the asset retirement obligation shown on the Companys balance sheet.
Angola
In November 2006, the Company signed a production sharing contract for Block 5 offshore Angola. The four year primary term with an optional three year extension awards the Company exploration rights to 1.4 million acres offshore central Angola. The Companys working interest is 40%. Additionally, the Company is required to carry the Angolan national oil company, Sonangol P&P, for 10% of the work program. During the first four years of the contract the Company was required to acquire and process 1,000 square kilometers of 3-D seismic data, drill two exploration wells and expend a minimum of $29.5 million ($14.8 million net to the Company). The Company fulfilled its seismic obligation when it acquired 1,175 square kilometers of 3-D seismic data at a cost of $7.5 million ($3.75 million net to the Company) in January 2007 and 524 square kilometers of 3-D seismic data during the fourth quarter of 2008 at a cost of $6.0 million ($3.0 million net to the Company).
The government-assigned working interest partner was delinquent paying their share of the costs several times in 2009 and consequently was placed in a default position. By a governmental decree dated December 1, 2010, the former partner was removed from the production sharing contract, and a one year time extension was granted for drilling the two exploration commitment wells. Following the decree, the Company and the government of Angola have been working together to obtain a replacement partner. In early 2012, the Angolan government granted a further one year extension to November 30, 2012 for drilling the two exploration commitment wells in accordance with the production sharing contract. In July 2012, the Angolan government granted an additional two year extension until November 30, 2014 to drill the two exploration commitment wells.
In the second quarter of 2012, the Company identified a potential partner to acquire the available 40% working interest and submitted the name of the interested party to the Angolan government for approval. In November 2012, the government advised the Company that it has entered into negotiations with the potential partner.
The remaining obligation is a two well exploration commitment. Each well is subject to a $5.0 million penalty ($10.0 million in aggregate for both wells) if not drilled during the contract term. The $10.0 million is currently recorded as restricted cash and is held at a financial institution located in the United States.
Because of the continuing uncertainty with the Angolan government approving a replacement partner, the Company has recorded a full allowance totaling $6.0 million as of December 31, 2012, against the accounts receivable from partners for the amounts owed to the Company above its 40% working interest plus the 10% carried interest. The allowance recorded in the twelve months ended December 31, 2012 totaled $1.6 million with the remainder having been recorded in 2011. The Company expects the gross receivable to be paid to the Company if a new partner in the block is approved.
United States
In September 2012, the Company acquired a 100% working interest in approximately 10,000 acres in Harding County, South Dakota. The primary objective for this property is the Red River formation. Pursuant to the terms of the acquisition, the Company is obligated to drill and complete a well, or reenter and complete an existing well within twelve months of the acquisition date. Once this obligation is met and within sixteen months of the acquisition date, the Company must elect to proceed or withdraw from the transaction. Should the Company elect to proceed, it must pay an additional amount of approximately $3.6 million and commit to drill and complete an additional well, or reenter and complete another existing well within twelve months of the date
F-16
Table of Contents
Index to Financial Statements
VAALCO ENERGY, INC AND SUBSIDIARIES
NOTES TO THE CONSOLIDATED FINANCIAL STATEMENTS(Continued)
the Company elects to proceed with the transaction. The Company drilled the initial well on the property in the first quarter of 2013, an unsuccessful effort, at a cost of approximately $2.9 million. The Company will record this amount as dry hole cost in the first quarter of 2013. The Company does not have plans to proceed with additional investments on this property.
| 7. | CAPITALIZATION OF EXPLORATORY WELL COSTS |
ASC Topic 932Extractive Industries provides that an exploratory well shall be capitalized as part of the entitys uncompleted wells pending the determination of whether the well has found proved reserves. Further, an exploration well that discovers oil and gas reserves, but those reserves cannot be classified as proved when drilling is completed, shall be capitalized if the well has found a sufficient quantity of reserves to justify its completion as a producing well and the entity is making sufficient progress assessing the reserves and the economic and operating viability of the project. If either condition is not met, the exploration well would be assumed to be impaired and its costs would be charged to expense.
In the second and third quarters of 2010, the Company drilled the Southeast Etame No. 1 well with two sidetracks in the Etame Marin block offshore Gabon. The well discovered five meters of oil-sand. Additional evaluation of the well and sidetrack information was conducted to facilitate options for developing the discovery. The Company and its joint venture partners evaluated the merits of two development options. One option involved a sub-sea well to develop the Southeast Etame discovery only, whereas the second option envisioned a platform development to access both the Southeast Etame area as well as the North Tchibala field, where a discovery was made on the block prior to VAALCOs block participation. In the second quarter of 2012, the Company and its partners agreed to proceed with the development plan featuring a fixed leg platform for developing the Southeast Etame discovery area and the North Tchibala field and the final investment decision was approved in the fourth quarter of 2012 for the construction of the platform. The Company has capitalized $8.1 million for this well in accordance with the criteria contained in ASC Topic 932.
In the third and fourth quarters of 2012, the Company drilled the NGongui No. 2 well with three sidetracks in the Mutamba Iroru block onshore Gabon. Evaluation of the well and sidetrack information is expected to continue through the second quarter of 2013. Concluding development options, receiving approval from Total Gabon, the joint venture partner, and filing a plan of development for approval by the government of Gabon is expected in the second half of 2013. The Company has capitalized $5.9 million for this well in accordance with the criteria contained in ASC Topic 932.
| 8. | EMPLOYEE BENEFIT PLANS |
The Company sponsors a 401(k) plan, with a Company match feature, for its employees. Costs incurred in 2012, 2011 and 2010 for administering the plan, including the Company match feature, were approximately $204,000, $172,000 and $150,000, respectively.
In the fourth quarter of 2012, the Company eliminated a retirement and severance policy for its employees. Costs incurred in 2012 to eliminate the plan were approximately $1.1 million in addition to the $2.3 million liability that had been recorded for this policy as of December 31, 2011. No payments to retiring employees were made in 2012, 2011, or 2010 under the former policy.
| 9. | ASSET RETIREMENT OBLIGATIONS |
The fair value of a liability for an asset retirement obligation is recognized in the period in which it is incurred by capitalizing it as part of the carrying amount of the long-lived assets. The Company records asset
F-17
Table of Contents
Index to Financial Statements
VAALCO ENERGY, INC AND SUBSIDIARIES
NOTES TO THE CONSOLIDATED FINANCIAL STATEMENTS(Continued)
retirement obligations for the future abandonment costs of tangible assets such as platforms, wells, pipelines and other facilities. The liability is accreted to its then present value each period, and the capitalized cost is depreciated over the useful life of the related asset. If the liability is settled for an amount other than the recorded amount, a gain or loss is recognized.
A summary of the recording of the estimated fair value of the Companys asset retirement obligations is presented as follows:
| (In Thousands) | Year Ended December 31, | |||||||||||
| 2012 | 2011 | 2010 | ||||||||||
| Balances at January 1, |
$ | 14,528 | $ | 13,425 | $ | 10,666 | ||||||
| Accretion Expense |
814 | 1,014 | 825 | |||||||||
| Additions |
770 | 96 | 2,016 | |||||||||
| Revisions |
(5,744 | ) | (7 | ) | (82 | ) | ||||||
|
|
|
|
|
|
|
|||||||
| Balance December 31, |
$ | 10,368 | $ | 14,528 | $ | 13,425 | ||||||
|
|
|
|
|
|
|
|||||||
During the year ended December 31, 2012, the Company increased the asset retirement obligations to recognize the abandonment liability for the exploratory well onshore Gabon, the second development well in the Granite Wash formation in North Texas, and 2 new exploratory wells in Montana. The $5.7 million asset retirement cost revision for 2012 was primarily due to changes in asset retirement cost estimates on the Etame block offshore Gabon. The increase in the asset retirement obligation in 2011 was due to the first development well in the Granite Wash formation in North Texas. During the year ended December 31, 2010, the Company increased the asset retirement obligations to recognize the abandonment liability for three new development wells (Ebouri 4-H, Etame 7-H, and S. Tchibala 2-H).
As of December 31, 2012, the Company had $44,000 legally restricted for settling asset retirement obligations in the United States.
The Company does not plan to abandon any material assets over the next five years.
F-18
Table of Contents
Index to Financial Statements
VAALCO ENERGY, INC AND SUBSIDIARIES
NOTES TO THE CONSOLIDATED FINANCIAL STATEMENTS(Continued)
| 10. | SEGMENT INFORMATION |
The Companys operations are based in Gabon, Angola, Equatorial Guinea, the British North Sea and in the United States. Management reviews and evaluates the operation of each geographic segment separately. The operations of all segments include exploration for and production of hydrocarbons where commercial reserves have been found and developed. The accounting policies of the reportable segments are the same as in Note 2. Revenues are based on the location of hydrocarbon production. The Company evaluates each segment based on income (loss) from operations. Segment activity for the years ended December 31, 2012, 2011 and 2010 are as follows: (in thousands)
| 2012 |
Gabon | Angola | Equatorial Guinea |
North Sea |
USA | Corporate and Other |
Total | |||||||||||||||||||||
| Revenues |
$ | 192,489 | $ | | $ | | $ | | $ | 2,798 | $ | | $ | 195,287 | ||||||||||||||
| Depreciation, depletion and amortization |
15,954 | 28 | | | 3,872 | 59 | 19,913 | |||||||||||||||||||||
| Operating income (loss) |
147,985 | (3,293 | ) | (754 | ) | (281 | ) | (48,940 | ) | (8,124 | ) | 86,593 | ||||||||||||||||
| Interest income |
60 | (1 | ) | | | | 86 | 145 | ||||||||||||||||||||
| Income taxes |
81,813 | | | | | | 81,813 | |||||||||||||||||||||
| Bad debt expenses |
| 1,621 | | | | | 1,621 | |||||||||||||||||||||
| Impairment of proved properties |
| | | | 7,620 | | 7,620 | |||||||||||||||||||||
| Additions to properties and equipment |
22,731 | | 10,000 | | 13,558 | 77 | 46,366 | |||||||||||||||||||||
| Long lived assets |
71,225 | 10,938 | 10,000 | | 14,279 | 166 | 106,608 | |||||||||||||||||||||
| Total assets |
190,652 | 11,405 | 10,000 | | 17,314 | 38,585 | 267,956 | |||||||||||||||||||||
| 2011 |
Gabon | Angola | Equatorial Guinea |
North Sea |
USA | Corporate and Other |
Total | |||||||||||||||||||||
| Revenues |
$ | 208,781 | $ | | $ | | $ | | 1,655 | $ | | $ | 210,436 | |||||||||||||||
| Depreciation, depletion and amortization |
23,604 | 20 | | | 1,922 | 50 | 25,596 | |||||||||||||||||||||
| Operating income (loss) |
155,550 | (6,221 | ) | | (382 | ) | (7,680 | ) | (8,706 | ) | 132,561 | |||||||||||||||||
| Interest income |
80 | | | | | 104 | 184 | |||||||||||||||||||||
| Income taxes |
93,468 | | | | | | 93,468 | |||||||||||||||||||||
| Bad debt expenses |
| 4,448 | | | | | 4,448 | |||||||||||||||||||||
| Impairment of proved properties |
| | | | 4,975 | | 4,975 | |||||||||||||||||||||
| Additions to properties and equipment |
8,528 | 7 | | | 24,371 | 60 | 32,966 | |||||||||||||||||||||
| Long lived assets |
68,965 | 10,964 | | | 19,772 | 147 | 99,848 | |||||||||||||||||||||
| Total assets |
185,341 | 21,452 | | | 22,236 | 45,986 | 275,015 | |||||||||||||||||||||
| 2010 |
Gabon | Angola | Equatorial Guinea |
North Sea |
USA | Corporate and Other |
Total | |||||||||||||||||||||
| Revenues |
$ | 134,346 | $ | | $ | | $ | | 126 | $ | | $ | 134,472 | |||||||||||||||
| Depreciation, depletion and amortization |
19,946 | 16 | | | 11 | 48 | 20,021 | |||||||||||||||||||||
| Operating income (loss) |
85,594 | (2,846 | ) | | (425 | ) | (387 | ) | (3,813 | ) | 78,123 | |||||||||||||||||
| Interest income |
85 | | | | | 66 | 151 | |||||||||||||||||||||
| Income taxes |
35,260 | | | | | | 35,260 | |||||||||||||||||||||
| Additions to properties and equipment |
38,082 | 27 | | | 2,260 | 83 | 40,452 | |||||||||||||||||||||
| Total assets |
181,642 | 14,081 | | | 3,189 | 39,488 | 238,400 | |||||||||||||||||||||
F-19
Table of Contents
Index to Financial Statements
VAALCO ENERGY, INC AND SUBSIDIARIES
NOTES TO THE CONSOLIDATED FINANCIAL STATEMENTS(Continued)
Information about our most significant customers
In Gabon, the Company sold oil under contracts with Mercuria Trading NV (Mercuria) in 2012 and 2011. In 2010, the Company sold its Gabon oil to Vitol S.A. In both 2012 and 2011, approximately 99% of total sales were made to Mercuria. In 2010, approximately 100% of total sales were made to Vitol S.A.
| 11. | IMPAIRMENT OF PROVED PROPERTIES |
The Company reviews its oil and gas producing properties for impairment whenever events or changes in circumstances indicate that the carrying amount of such properties may not be recoverable. When it is determined that an oil and gas propertys estimated future net cash flows will not be sufficient to recover its carrying amount, an impairment charge must be recorded to reduce the carrying amount of the asset to its estimated fair value.
In the United States, the Company recorded impairment losses of $7.6 million and $5.0 million in 2012 and 2011, respectively, to write down the value of its Hefley field in the Granite Wash formation to its estimated fair value. A combination of continued production declines from both producing wells and low natural gas prices has had a negative impact on the fair value of the assets and an impairment charge was warranted.
The initial measurement of these assets at fair value is calculated using discounted cash flow techniques and based on estimates of future revenues and costs associated with the Granite Wash formation well. Significant Level 3 assumptions associated with the calculation of discounted cash flows used in the impairment analysis include the Companys estimate of future crude oil and natural gas prices, production costs, development expenditures, and anticipated production of proved and probable reserves, appropriate risk-adjusted discount rates and other relevant data. For crude oil, estimates were based on NYMEX West Texas Intermediate prices, adjusted for quality, transportation fees, and a regional price differential. For natural gas, estimates were based on NYMEX Henry Hub prices, adjusted for energy content, transportation fees, and a regional price differential.
| 12. | QUARTERLY FINANCIAL INFORMATION (UNAUDITED) |
The following represents our unaudited quarterly results for years ended December 31, 2012 and 2011. The quarterly results were prepared in accordance with accounting principles generally accepted in the United States of America, and reflect all adjustments that are, in the opinion of management, necessary for a fair statement of the results. These adjustments are of a normal recurring nature.
| (In thousands of dollars except per share information) | 1st Quarter |
2nd Quarter |
3rd Quarter |
4th Quarter |
||||||||||||
| 2012 |
||||||||||||||||
| Total revenues(1) |
$ | 45,286 | $ | 58,818 | $ | 37,630 | $ | 53,553 | ||||||||
| Total operating costs and expenses |
15,180 | 20,186 | 22,036 | 51,292 | ||||||||||||
| Operating income |
30,106 | 38,632 | 15,594 | 2,261 | ||||||||||||
| Net income |
10,527 | 12,317 | 1,412 | (18,917 | ) | |||||||||||
| Net income attributable to noncontrolling interest |
(1,509 | ) | (1,893 | ) | (1,306 | ) | | |||||||||
| Net income attributable to VAALCO Energy, Inc. |
9,018 | 10,424 | 106 | (18,917 | ) | |||||||||||
| Basic net income per share attributable to VAALCO Energy, Inc. |
$ | 0.16 | $ | 0.18 | $ | | $ | (0.33 | ) | |||||||
| Diluted net income per share attributable to VAALCO Energy, Inc. |
$ | 0.15 | $ | 0.18 | $ | | $ | (0.32 | ) | |||||||
F-20
Table of Contents
Index to Financial Statements
VAALCO ENERGY, INC AND SUBSIDIARIES
NOTES TO THE CONSOLIDATED FINANCIAL STATEMENTS(Continued)
| (In thousands of dollars except per share information) | 1st Quarter |
2nd Quarter |
3rd Quarter |
4th Quarter |
||||||||||||
| 2011 |
||||||||||||||||
| Total revenues |
$ | 46,772 | $ | 58,547 | $ | 37,350 | $ | 67,767 | ||||||||
| Total operating costs and expenses |
15,430 | 16,035 | 17,531 | 28,879 | ||||||||||||
| Operating income |
31,342 | 42,512 | 19,819 | 38,888 | ||||||||||||
| Net income |
12,896 | 13,510 | 3,455 | 10,701 | ||||||||||||
| Net income attributable to noncontrolling interest |
(1,657 | ) | (1,723 | ) | (1,056 | ) | (1,981 | ) | ||||||||
| Net income attributable to VAALCO Energy, Inc. |
11,239 | 11,787 | 2,399 | 8,720 | ||||||||||||
| Basic net income per share attributable to VAALCO Energy, Inc. |
$ | 0.20 | $ | 0.21 | $ | 0.04 | $ | 0.15 | ||||||||
| Diluted net income per share attributable to VAALCO Energy, Inc. |
$ | 0.19 | $ | 0.20 | $ | 0.04 | $ | 0.15 | ||||||||
| (1) | The number of oil liftings conducted offshore Gabon were 2, 4, 3, and 5 for the 1st quarter, the 2nd quarter, the 3rd quarter, and the 4th quarter, respectively |
Quarterly income per share is based on the weighted average number of shares outstanding during the quarter. Because of changes in the number of shares outstanding during the quarters due to the exercise of stock options and issuance of common stock, the sum of quarterly earnings per share may not equal earnings per share for the year.
| 13. | SUPPLEMENTAL INFORMATION ON OIL AND GAS PRODUCING ACTIVITIES (UNAUDITED) |
The following information is being provided as supplemental information in accordance with certain provisions of ASC Topic 932Extractive ActivitiesOil and Gas. The Companys reserves are located offshore of Gabon and in Texas. The following tables set forth costs incurred, capitalized costs, and results of operations relating to oil and natural gas producing activities for each of the periods. (See Footnote 1ORGANIZATION)
Costs Incurred in Oil and Gas Property
Acquisition, Exploration and Development Activities
| (In thousands) | United States | |||||||||||
| 2012 | 2011 | 2010 | ||||||||||
| Costs incurred during the year: |
||||||||||||
| Explorationcapitalized |
$ | 2,602 | | $ | | |||||||
| Explorationexpensed |
38,159 | 2,083 | 392 | |||||||||
| Acquisition |
1,630 | 9,495 | 2,240 | |||||||||
| Development |
9,689 | 14,936 | | |||||||||
|
|
|
|
|
|
|
|||||||
| Total |
$ | 52,080 | 26,514 | $ | 2,632 | |||||||
|
|
|
|
|
|
|
|||||||
| (In thousands) | International | |||||||||||
| 2012 | 2011 | 2010 | ||||||||||
| Costs incurred during the year: |
||||||||||||
| Explorationcapitalized |
$ | 5,916 | $ | 69 | $ | 8,020 | ||||||
| Explorationexpensed |
2,878 | 3,625 | 6,421 | |||||||||
| Acquisition |
10,000 | 455 | 1,200 | |||||||||
| Development |
4,022 | 8,011 | 29,927 | |||||||||
|
|
|
|
|
|
|
|||||||
| Total |
$ | 22,816 | $ | 12,160 | $ | 45,568 | ||||||
|
|
|
|
|
|
|
|||||||
F-21
Table of Contents
Index to Financial Statements
VAALCO ENERGY, INC AND SUBSIDIARIES
NOTES TO THE CONSOLIDATED FINANCIAL STATEMENTS(Continued)
Exploration expense includes $37.3 million, $0.1 million and $2.6 million for dry hole expense in 2012, 2011 and 2010, respectively. The dry hole expense for 2012 was attributable to five unsuccessful exploration wells drilled in the United States.
In November 2012, the Company completed the acquisition of a 31% working interest in the block at a cost of $10.0 million
Capitalized Costs Relating to Oil and Gas Producing Activities:
| December 31, | ||||||||||||
| 2012 | 2011 | 2010 | ||||||||||
| Capitalized costs |
$ | 66,794 | $ | 46,047 | $ | 25,504 | ||||||
| Properties being amortized(1) |
195,329 | 182,820 | 170,457 | |||||||||
|
|
|
|
|
|
|
|||||||
| Total capitalized costs |
$ | 262,123 | $ | 228,867 | $ | 195,961 | ||||||
| Less accumulated depreciation, depletion, and amortization |
(155,681 | ) | (129,166 | ) | (99,277 | ) | ||||||
|
|
|
|
|
|
|
|||||||
| Net capitalized costs |
$ | 106,442 | $ | 99,701 | $ | 96,684 | ||||||
|
|
|
|
|
|
|
|||||||
| (1) | Includes $4.7 million, $10.4 million, and $10.3 million asset retirement cost in 2012, 2011, and 2010, respectively. |
The capitalized costs pertain to the Companys producing activities in Gabon, leasehold acreage in Gabon, Angola, and Equatorial Guinea, and U.S. activities.
Results of Operations for Oil and Gas Producing Activities:
| United States | International | |||||||||||||||||||||||
| 2012 | 2011 | 2010 | 2012 | 2011 | 2010 | |||||||||||||||||||
| Gabon | Gabon | Gabon | ||||||||||||||||||||||
| Crude oil and gas sales |
$ | 2,798 | $ | 1,655 | $ | 126 | $ | 192,489 | $ | 208,781 | $ | 134,346 | ||||||||||||
| Production, G&A and other expense |
(47,866 | ) | (7,413 | ) | (495 | ) | (27,425 | ) | (27,471 | ) | (28,614 | ) | ||||||||||||
| Depreciation, depletion and amortization |
(3,872 | ) | (1,922 | ) | (11 | ) | (15,954 | ) | (23,604 | ) | (19,946 | ) | ||||||||||||
| Income tax |
| | (7 | ) | (81,813 | ) | (93,468 | ) | (35,260 | ) | ||||||||||||||
|
|
|
|
|
|
|
|
|
|
|
|
|
|||||||||||||
| Results from oil and gas producing activities |
$ | (48,940 | ) | $ | (7,680 | ) | $ | (387 | ) | $ | 67,297 | $ | 64,238 | $ | 50,526 | |||||||||
|
|
|
|
|
|
|
|
|
|
|
|
|
|||||||||||||
F-22
Table of Contents
Index to Financial Statements
VAALCO ENERGY, INC AND SUBSIDIARIES
NOTES TO THE CONSOLIDATED FINANCIAL STATEMENTS(Continued)
Proved Reserves
Reserve reports as of December 31, 2012, 2011, and 2010 have been prepared by Netherland, Sewell & Associates, Inc., independent petroleum engineers. The following tables set forth the net proved reserves of the Company as of December 31, 2012, 2011 and 2010, and the changes during such periods.
| Oil (MBbls) | Gas (MMCF) | |||||||
| PROVED RESERVES: |
||||||||
| BALANCE AT JANUARY 1, 2010 |
7,363 | 23 | ||||||
| Production |
(1,715 | ) | (38 | ) | ||||
| Revisions of previous estimates |
1,274 | 38 | ||||||
| Extensions and discoveries |
| | ||||||
|
|
|
|
|
|||||
| BALANCE AT DECEMBER 31, 2010 |
6,922 | 23 | ||||||
| Production |
(1,868 | ) | (255 | ) | ||||
| Revisions of previous estimates |
959 | 31 | ||||||
| Extensions and discoveries |
35 | 2,126 | ||||||
|
|
|
|
|
|||||
| BALANCE AT DECEMBER 31, 2011 |
6,048 | 1,925 | ||||||
| Production |
(1,741 | ) | (532 | ) | ||||
| Revisions of previous estimates |
2,200 | 151 | ||||||
| Extensions and discoveries |
981 | | ||||||
|
|
|
|
|
|||||
| BALANCE AT DECEMBER 31, 2012 |
7,488 | 1,544 | ||||||
|
|
|
|
|
|||||
| Oil (MBbls) | Gas (MMCF) | |||||||
| PROVED DEVELOPED RESERVES |
||||||||
| Balance at January 1, 2010 |
4,795 | 23 | ||||||
| Balance at December 31, 2010 |
5,029 | 23 | ||||||
| Balance at December 31, 2011 |
3,854 | 856 | ||||||
| Balance at December 31, 2012 |
3,750 | 1,544 | ||||||
The Companys proved developed reserves are located offshore Gabon and in Texas. Revisions in 2010 were primarily associated with better reservoir performance in several of the Etame Marin block fields. Revisions in 2011 were attributable to better reservoir performance at the Etame, Avouma, South Tchibala and Ebouri fields. In 2011, discoveries were attributable to the Granite Wash formation leases in North Texas. Revisions in 2012 were attributable to better reservoir performance at the Etame, Avouma, South Tchibala and Ebouri fields. In 2012, discoveries were attributable to the South-East Etame and North Tchibala fields offshore Gabon.
The Company maintains a policy of not booking proved reserves on discoveries until such time as a development plan has been prepared for the discovery. Additionally, the development plan is required to have the approval of the Companys partners in the discovery. Furthermore, if a government agreement that the reserves are commercial is required to develop the field, this approval must have been received prior to booking any reserves.
Standardized Measure of Discounted Future Net Cash
Flows Relating to Proved Oil Reserves
The information that follows has been developed pursuant to procedures prescribed by ASC Topic 932 and utilizes reserve and production data estimated by independent petroleum consultants. The information may be useful for certain comparison purposes, but should not be solely relied upon in evaluating VAALCO Energy, Inc. or its performance.
F-23
Table of Contents
Index to Financial Statements
VAALCO ENERGY, INC AND SUBSIDIARIES
NOTES TO THE CONSOLIDATED FINANCIAL STATEMENTS(Continued)
In accordance with the guidelines of the SEC, the Companys estimates of future net cash flow from the Companys properties and the present value thereof are made using oil and gas contract prices using a twelve month average of beginning of month prices and are held constant throughout the life of the properties except where such guidelines permit alternate treatment, including the use of fixed and determinable contractual price escalations. The future cash flows are also based on costs in existence at the dates of the projections, excluding Gabon royalties, and the interests of other consortium members. Future production costs do not include overhead charges allowed under joint operating agreements or headquarters general and administrative overhead expenses. Future development costs include $45.7 million attributable to future abandonment when the wells become uneconomic to produce.
| (In thousands) | United States | International | Total | |||||||||||||||||||||||||||||||||
| December 31, | December 31, | December 31, | ||||||||||||||||||||||||||||||||||
| 2012 | 2011 | 2010 | 2012 | 2011 | 2010 | 2012 | 2011 | 2010 | ||||||||||||||||||||||||||||
| Future cash inflows |
$ | 8,260 | $ | 13,274 | $ | 407 | $ | 776,646 | $ | 623,546 | $ | 517,051 | $ | 784,906 | $ | 636,820 | $ | 517,458 | ||||||||||||||||||
| Future production costs |
(3,194 | ) | (1,661 | ) | (203 | ) | (203,490 | ) | (154,020 | ) | (140,470 | ) | (206,684 | ) | (155,681 | ) | (140,673 | ) | ||||||||||||||||||
| Future development costs |
| (4,180 | ) | | (186,982 | ) | (85,528 | ) | (71,190 | ) | (186,982 | ) | (89,708 | ) | (71,190 | ) | ||||||||||||||||||||
| Future income tax expense |
(807 | ) | (1,347 | ) | (34 | ) | (181,194 | ) | (181,886 | ) | (159,811 | ) | (182,001 | ) | (183,233 | ) | (159,845 | ) | ||||||||||||||||||
|
|
|
|
|
|
|
|
|
|
|
|
|
|
|
|
|
|
|
|||||||||||||||||||
| Future net cash flows |
$ | 4,259 | $ | 6,086 | $ | 170 | $ | 204,980 | $ | 202,112 | $ | 145,580 | $ | 209,239 | $ | 208,198 | $ | 145,750 | ||||||||||||||||||
| Discount to present value at 10% annual rate |
(1,028 | ) | (3,150 | ) | (41 | ) | (55,309 | ) | (38,861 | ) | (20,885 | ) | (56,337 | ) | (42,011 | ) | (20,926 | ) | ||||||||||||||||||
|
|
|
|
|
|
|
|
|
|
|
|
|
|
|
|
|
|
|
|||||||||||||||||||
| Standardized measure of discounted future net cash flows |
$ | 3,231 | $ | 2,936 | $ | 129 | $ | 149,671 | $ | 163,251 | $ | 124,695 | $ | 152,902 | $ | 166,187 | $ | 124,824 | ||||||||||||||||||
|
|
|
|
|
|
|
|
|
|
|
|
|
|
|
|
|
|
|
|||||||||||||||||||
International income taxes represent amounts payable to the Government of Gabon on profit oil as final payment of corporate income taxes, and domestic income taxes represent amounts payable for severance taxes in Texas.
Changes in Standardized Measure of Discounted Future Net Cash Flows:
The following table sets forth the changes in standardized measure of discounted future net cash flows as follows:
| (In thousands) | December 31, | |||||||||||
| 2012 | 2011 | 2010 | ||||||||||
| BALANCE AT BEGINNING OF PERIOD |
$ | 166,187 | $ | 124,824 | $ | 102,518 | ||||||
| Sales of oil and gas, net of production costs |
(168,563 | ) | (183,705 | ) | (112,360 | ) | ||||||
| Net changes in prices and production costs |
(11,223 | ) | 194,633 | 139,810 | ||||||||
| Revisions of previous quantity estimates |
155,111 | 75,713 | 71,600 | |||||||||
| Additions |
69,092 | 7,742 | | |||||||||
| Changes in estimated future development costs |
(67,834 | ) | (5,831 | ) | (5,337 | ) | ||||||
| Development costs incurred during the period |
34,944 | 31,913 | 37,531 | |||||||||
| Accretion of discount |
16,619 | 12,482 | 10,252 | |||||||||
| Net change of income taxes |
7,445 | 4,455 | (31,482 | ) | ||||||||
| Change in production rates (timing) and other |
(48,876 | ) | (96,039 | ) | (87,708 | ) | ||||||
|
|
|
|
|
|
|
|||||||
| BALANCE AT END OF PERIOD |
$ | 152,902 | $ | 166,187 | $ | 124,824 | ||||||
|
|
|
|
|
|
|
|||||||
There are numerous uncertainties inherent in estimating quantities of proved reserves and in projecting future rates of production and timing of development expenditures, including many factors beyond the control of the Company. Reserve engineering is a subjective process of estimating underground accumulations of oil and
F-24
Table of Contents
Index to Financial Statements
VAALCO ENERGY, INC AND SUBSIDIARIES
NOTES TO THE CONSOLIDATED FINANCIAL STATEMENTS(Continued)
gas that cannot be measured in an exact manner and the accuracy of any reserve estimate is a function of the quality of available data and of engineering and geological interpretation and judgment. The quantities of oil and gas that are ultimately recovered, production and operating costs, the amount and timing of future development expenditures and future oil and gas sales prices may all differ from those assumed in these estimates. The standardized measure of discounted future net cash flow should not be construed as the current market value of the estimated oil and natural gas reserves attributable to the Companys properties. The information set forth in the foregoing tables includes revisions for certain reserve estimates attributable to proved properties included in the preceding years estimates. Such revisions are the result of additional information from subsequent completions and production history from the properties involved or the result of a decrease (or increase) in the projected economic life of such properties resulting from changes in product prices. Moreover, crude oil amounts shown for Gabon are recoverable under a service contract and the reserves in place remain the property of the Gabon government.
In accordance with the guidelines of the Securities and Exchange Commission, the Companys estimates of future net cash flow from the Companys properties and the present value thereof are made using oil and gas contract prices using a twelve month average of beginning of month prices and are held constant throughout the life of the properties except where such guidelines permit alternate treatment, including the use of fixed and determinable contractual price escalations. In Gabon, the price was $113.08 per Bbl. In the United States, the price was $85.07 per Bbl of oil and $3.515 per Mcf of gas.
Under the Production Sharing Contract in Gabon, the Gabonese government is the owner of all oil and gas mineral rights. The right to produce the oil and gas is stewarded by the Directorate Generale de Hydrocarbures and the Production Sharing Contract was awarded by a decree from the State. Pursuant to the service contract, the Gabon government receives a fixed royalty rate of 13%.
The consortium maintains a Cost Account, which entitles it to receive 70% of the production remaining after deducting the royalty so long as there are amounts remaining in the Cost Account. At December 31, 2012, there was $1.2 million in the cost account net to the Company. As payment of corporate income taxes the consortium pays the government an allocation of the remaining profit oil production from the contract area ranging from 50% to 60% of the oil remaining after deducting the royalty and the cost oil. The percentage of profit oil paid to the government as tax is a function of production rates. So long as amounts remain in the Cost Account, the net share that the consortium receives from production can range from a low of 67.7% of production at production rate in excess of 25,000 BOPD to a high of 82.5% of production at rates below 5,000 BOPD. However, when the Cost Account becomes substantially recovered, the Company only recovers ongoing operating expenses and new project capital expenditures, resulting in a higher tax rate. The Cost Account has been substantially recovered since the first quarter of 2005. In 2010, the Company cost recovered 838,000 barrels out of a theoretical 1,200,000 barrels which would have been recoverable if the Cost Account was full. In 2011, the Company cost recovered 304,000 barrels out of a theoretical 1,303,000 barrels which would have been recoverable if the Cost Account was full. In 2012, the Company cost recovered 367,000 barrels out of a theoretical 1,197,000 barrels which would have been recoverable if the Cost Account was full.
Also because of the nature of the Cost Account, increases in oil prices result in a lesser number of barrels required to recover costs, therefore at higher oil prices, the Companys net reserves after taxes would decrease, but at lower prices the Companys Cost Oil barrels increase.
The Etame Production Sharing Contract allows for the carve-out of a development area, which was performed for the Etame, Avouma and Ebouri fields. The Etame development area has a term of 20 years and will expire in 2021. The Avouma field development area has a term of 20 years and will expire in 2025. The
F-25
Table of Contents
Index to Financial Statements
VAALCO ENERGY, INC AND SUBSIDIARIES
NOTES TO THE CONSOLIDATED FINANCIAL STATEMENTS(Continued)
Ebouri field development area has a term of 20 years and will expire in 2026. The Company expects to apply for development areas in 2013 for the Southeast Etame and North Tchibala fields. The balance of the Etame Marin block comprises the exploration area, which expires in July 2014.
Under the service contract, it is not anticipated that the Gabonese government will take physical delivery of its allocated production. Instead, the Company is authorized to sell the Gabonese governments share of production and remit the proceeds to the Gabonese government.
The Mutamba Iroru production sharing contract entitles the Company to receive 70% of any future production remaining after deducting the royalty so long as there are amounts remaining in the Cost Account. At December 31, 2012 there was $34.1 million in the Cost Account. As payment of corporate income taxes the consortium pays the government an allocation of the remaining profit oil production from the contract area ranging from 50% to 63% of the oil remaining after deducting the royalty and the cost oil. The percentage of profit oil paid to the government as tax is a function of production rates. So long as amounts remain in the Cost Account, the net share that the consortium receives from production can range from a low of 72% of production at production rate in excess of 20,000 BOPD to a high of 85% of production at rates below 7,500 Bbl per day. However, when the Cost Account becomes substantially recovered, the Company only recovers ongoing operating expenses and new project capital expenditures, resulting in a higher tax rate. The Mutamba Iroru service contract provides for all commercial discoveries to be reclassified into a development area with a term of twenty years. At December 31, 2012, the Company has no proved reserves related to the Mutamba Iroru block.
The Block 5 production sharing contract in Angola entitles the Company to receive 50% of the any future production so long as there are amounts remaining in the Cost Account. There are no royalty payments under the contract. The consortium pays the government an allocation of the remaining profit oil production from the contract area ranging from 30% to 90% of the oil remaining after deducting the cost oil. The percentage of profit oil paid to the government as tax is a function of the Companys rate of return for each development area. The Block 5 production sharing contract provides for a discovery to be reclassified into a development area with a term of twenty years. At December 31, 2012, the Company has no proved reserves related to Block 5 in Angola.
The Block P production sharing contract in Equatorial Guinea entitles the Company to receive up to 70% of the any future production after royalty deduction so long as there are amounts remaining in the Cost Account. Royalty rates are 10-16% depending on production rates. The consortium pays the government an allocation of the remaining profit oil production from the contract area ranging from 10% to 60% of the oil remaining after deducting the royalty and cost oil. The percentage of profit oil paid to the government as tax is a function of cumulative production. In addition, Equatorial Guinea imposes a 25% income tax on net profits. The Block P production sharing contract provides for a discovery to be reclassified into a development area with a term of twenty five years. At December 31, 2012, the Company has no proved reserves related to Block P in Equatorial Guinea.
F-26