NYSE:EGY
VAALCO ENERGY, INC
Third Quarter 2015
Supplemental Information
2
Safe Harbor Statement
VAALCO ENERGY, INC
This document includes "forward-looking statements" within the meaning of Section 27A of the Securities Act of 1933, as amended, and Section 21E of the Securities Exchange Act of 1934, as amended. Forward-looking statements are those concerning VAALCO's plans, expectations, and objectives for future drilling, completion and other operations and activities. All statements included in this document that address activities, events or developments that VAALCO expects, believes or anticipates will or may occur in the future are forward-looking statements. These statements include expected capital expenditures, future drilling plans, prospect evaluations, availability of capital, negotiations with governments and third parties, expectations regarding processing facilities, and reserve growth. These statements are based on assumptions made by VAALCO based on its experience and perception of historical trends, current conditions, expected future developments and other factors it believes are appropriate in the circumstances. Such statements are subject to a number of assumptions, risks and uncertainties, many of which are beyond VAALCO's control. These risks include, but are not limited to, oil and gas price volatility, inflation, general economic conditions, the Company's success in discovering, developing and producing reserves, lack of availability of goods, services and capital, environmental risks, drilling risks, foreign operational risks, and regulatory changes. These and other risks are further described in VAALCO's quarterly reports on Form 10-Q for the three months ended March 31, 2015, June 30, 2015 and September 30, 2015, annual report on Form 10-K for the years ended December 31, 2014, and other reports filed with the SEC which can be reviewed at http://www.sec.gov, or which can be received by contacting VAALCO at 9800 Richmond Avenue, Suite 700, Houston, Texas 77042, (713) 623-0801. Investors are cautioned that forward-looking statements are not guarantees of future performance and that actual results or developments may differ materially from those projected in the forward-looking statements. VAALCO disclaims any intention or obligation to update or revise any forward-looking statements, whether as a result of new information, future events, or otherwise. .The SEC generally permits oil and natural gas companies, in filings made with the SEC, to disclose proved reserves, which are reserve estimates that geological and engineering data demonstrate with reasonable certainty to be recoverable in future years from known reservoirs under existing economic and operating conditions and certain probable and possible reserves that meet the SEC’s definitions for such terms. In this press release and the conference call, the Company may use the terms “resource potential” and “oil in place”, which the SEC guidelines restrict from being included in filings with the SEC without strict compliance with SEC definitions. These terms refer to the Company’s internal estimates of unbooked hydrocarbon quantities that may be potentially added to proved reserves. Unbooked resource potential and oil in place do not constitute reserves within the meaning of the Society of Petroleum Engineer’s Petroleum Resource Management System or SEC rules and do not include any proved reserves. Actual quantities of reserves that may be ultimately recovered from the
Company’s interests may differ substantially from those presented herein. Factors affecting ultimate recovery include the scope of the Company’s ongoing drilling program, which will be directly affected by the availability of capital, decreases in oil and natural gas prices, drilling and production costs, availability of drilling services and equipment, drilling results, lease expirations, transportation constraints, processing costs, regulatory approvals, negative revisions to reserve estimates and other factors as well as actual drilling results, including geological and mechanical factors affecting recovery rates. Estimates of unproved reserves may change significantly as development of the Company’s assets provides additional data. In addition, our production forecasts and expectations for future periods are dependent upon many assumptions, including estimates of production decline rates from existing wells and the undertaking and outcome of future drilling activity, which may be affected by significant commodity price declines or drilling cost increases.
Investor Contacts
Gregory R. Hullinger Chief Financial Officer 713-623-0801
Al Petrie Investor Relations Coordinator 713-543-3422
Important Additional Information.In connection with the consent solicitation initiated by the Group 42-BLR Group, the Company may file a consent revocation statement and other documents regarding the proposals of the Group 42-BLR Group with the SEC and may mail a consent revocation statement and a consent revocation card to each stockholder of record entitled to deliver a written consent with respect to the proposals of the Group 42-BLR Group. STOCKHOLDERS ARE ENCOURAGED TO READ ANY CONSENT REVOCATION STATEMENT AND ANY OTHER RELEVANT DOCUMENTS FILED WITH THE SEC WHEN THEY BECOME AVAILABLE, BECAUSE THEY WILL CONTAIN IMPORTANT INFORMATION. .The Company, its directors and executive officers may be deemed to be participants in the solicitation of consent revocations in connection with the proposals of the Group 42-BLR Group. Information regarding the names of the Company’s participants and their respective interests in the Company by security holdings or otherwise is set forth in the proxy statement for the Company’s 2015 Annual Meeting of Stockholders as filed with the SEC on Schedule 14A on April 16, 2015. To the extent names of the Company’s directors and executive officers and their holdings in the Company’s securities have changed since the 2015 proxy statement, such changes have been reflected on Initial Statements of Beneficial Ownership on Form 3 or Statements of Change in Ownership on Form 4 filed with the SEC. Additional information can also be found in the Company’s Annual Report on Form 10-K for the year ended December 31, 2014, filed with the SEC on March 16, 2015 and in the Company’s Quarterly Reports on Form 10-Q for the first two quarters of the fiscal year ending December 31, 2015 filed with the SEC on May 7, 2015 and August 6, 2015, respectively. Additional information regarding the interests of the Company’s participants in any solicitation of consent revocations in connection with the proposals of the Group 42-BLR Group and other relevant materials, if any, will be filed with the SEC when they become available. .These documents, including any consent revocation statement (and amendments or supplements thereto) and other documents filed by the Company with the SEC, are or will be available for no charge at the SEC’s website at www.sec.gov and at the Company’s investor relations website at vaalco.investorroom.com. Copies may also be obtained by contacting the Company by mail at 9800 Richmond, Suite 700, Houston, Texas 77042, Attention: Corporate Secretary or by telephone at (713) 623-0801.
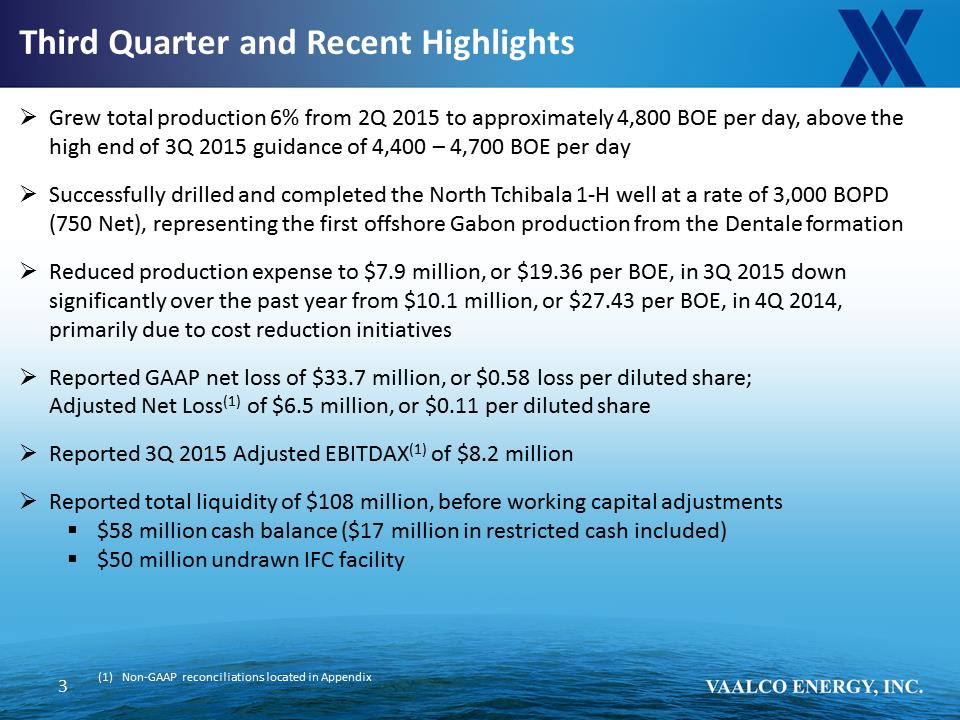
Third Quarter and Recent Highlights.Grew total production 6% from 2Q 2015 to approximately 4,800 BOE per day, above the high end of 3Q 2015 guidance of 4,400 – 4,700 BOE per day .Successfully drilled and completed the North Tchibala 1-H well at a rate of 3,000 BOPD (750 Net), representing the first offshore Gabon production from the Dentale formation .Reduced production expense to $7.9 million, or $19.36 per BOE, in 3Q 2015 down significantly over the past year from $10.1 million, or $27.43 per BOE, in 4Q 2014, primarily due to cost reduction initiatives .Reported GAAP net loss of $33.7 million, or $0.58 loss per diluted share; Adjusted Net Loss(1) of $6.5 million, or $0.11 per diluted share .Reported 3Q 2015 Adjusted EBITDAX(1) of $8.2 million .Reported total liquidity of $108 million, before working capital adjustments .$58 million cash balance ($17 million in restricted cash included) .$50 million undrawn IFC facility 3
(1)Non-GAAP reconciliations located in Appendix
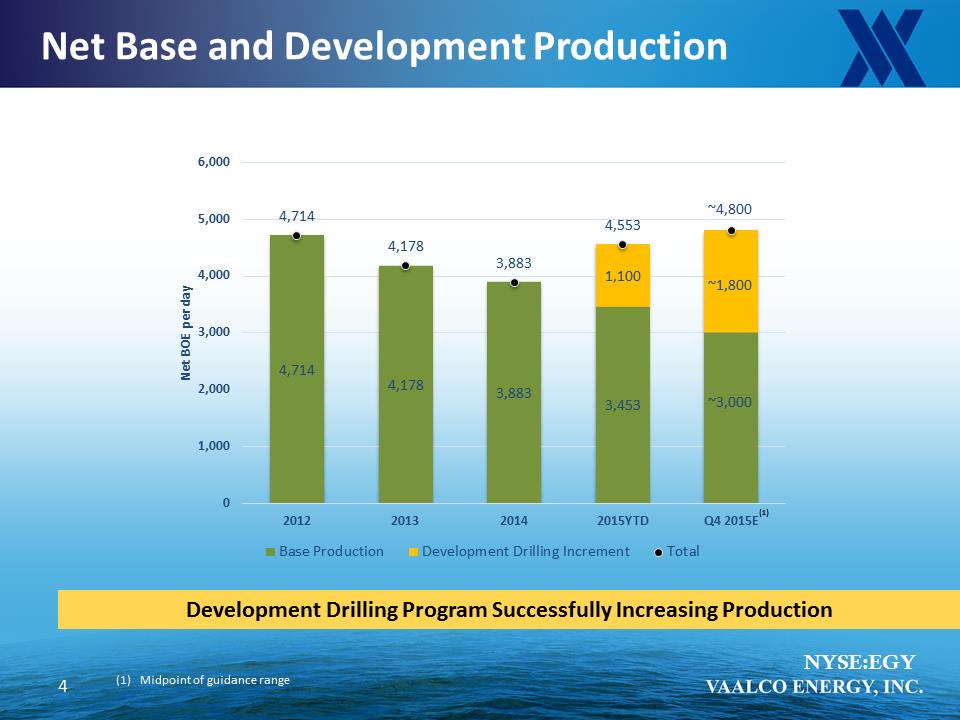
NYSE:EGY Net Base and Development Production 4,714 4,178 3,883 3,453 1,100 4,714 4,178 3,883 4,553 0 1,000 2,000 3,000 4,000 5,000 6,000 2012 2013 2014 2015YTD Q4 2015E Net BOE per day Base Production Development Drilling Increment
Total
4 (1)Midpoint of guidance range
(1)
~4,800
~1,800
~3,000
Development Drilling Program Successfully Increasing Production
NYSE:EGY
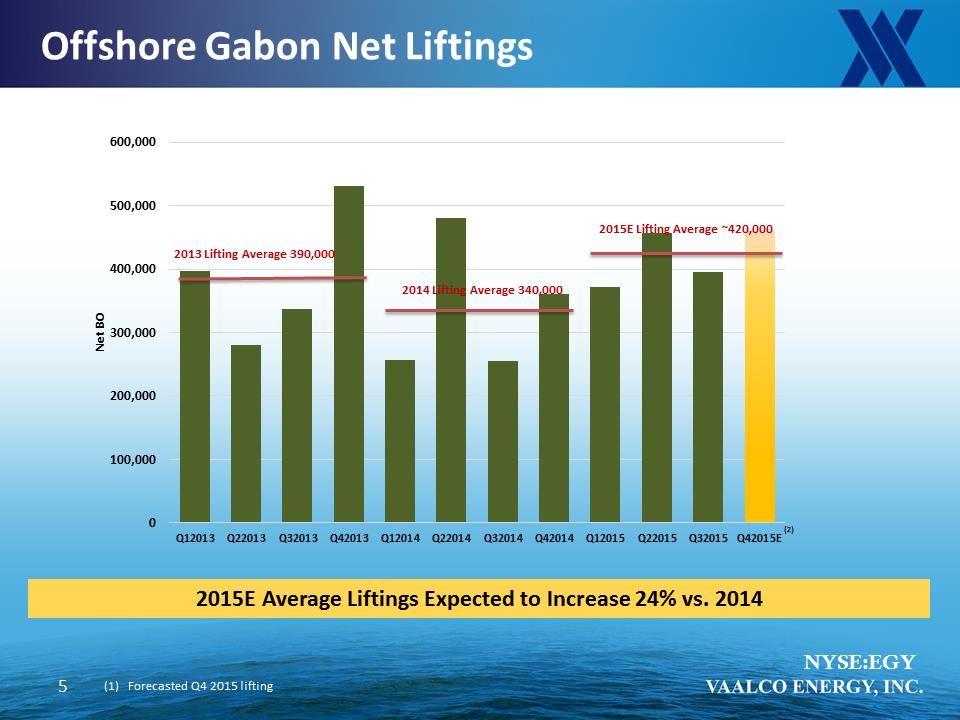
Offshore Gabon Net Liftings
0
100,000
200,000
300,000
400,000
500,000
600,000
Q12013
Q22013
Q32013
Q42013
Q12014
Q22014
Q32014
Q42014
Q12015
Q22015
Q32015
Q42015E
Net BO
2013 Lifting Average 390,000
2014 Lifting Average 340,000
2015E Lifting Average ~420,000
5
(2)
(1)Forecasted Q4 2015 lifting
2013 Lifting Average 390,000
2014 Lifting Average 340,000
2015E Lifting Average ~420,000
2015E Average Liftings Expected to Increase 24% vs. 2014
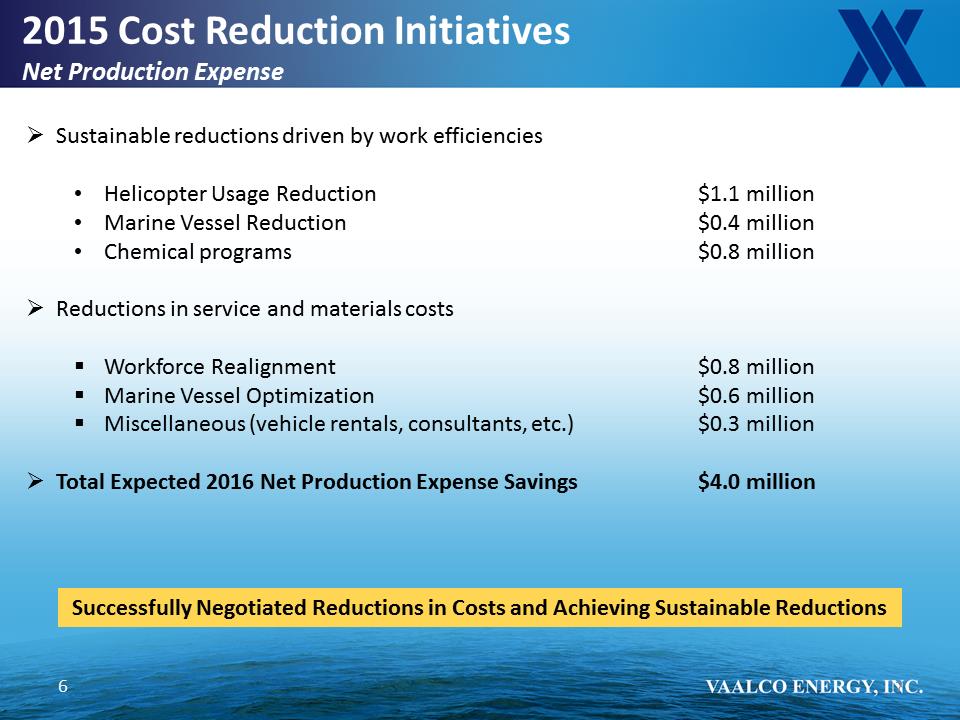
2015 Cost Reduction Initiatives
Net Production Expense
.Sustainable reductions driven by work efficiencies
•Helicopter Usage Reduction $1.1 million
•Marine Vessel Reduction $0.4 million
•Chemical programs $0.8 million
.Reductions in service and materials costs
.Workforce Realignment $0.8 million
.Marine Vessel Optimization $0.6 million
.Miscellaneous (vehicle rentals, consultants, etc.) $0.3 million
.Total Expected 2016 Net Production Expense Savings $4.0 million
Successfully Negotiated Reductions in Costs and Achieving Sustainable Reductions 6
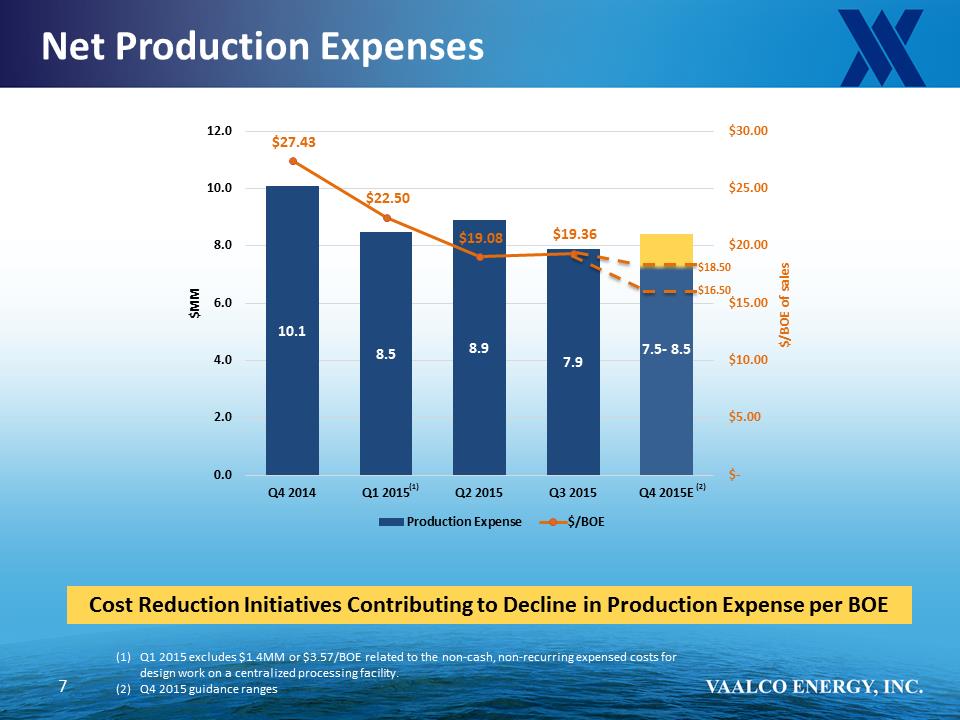
Net Production Expenses
7
10.1
8.5 8.9
7.9
$27.43
$22.50
$19.08 $19.36
$-
$5.00
$10.00
$15.00
$20.00
$25.00
$30.00
0.0
2.0
4.0
6.0
8.0
10.0
12.0
Q4 2014
Q1 2015
Q2 2015
Q3 2015
Q4 2015E
$/BOE of sales
$MM Production Expense
$/BOE
(2)
(1)
$16.50
$18.50
7.5- 8.5
Cost Reduction Initiatives Contributing to Decline in Production Expense per BOE (1)Q1 2015 excludes $1.4MM or $3.57/BOE related to the non-cash, non-recurring expensed costs for design work on a centralized processing facility.
(2)Q4 2015 guidance ranges
8
2015 Cost Reduction Initiatives
Net General & Administrative Expense
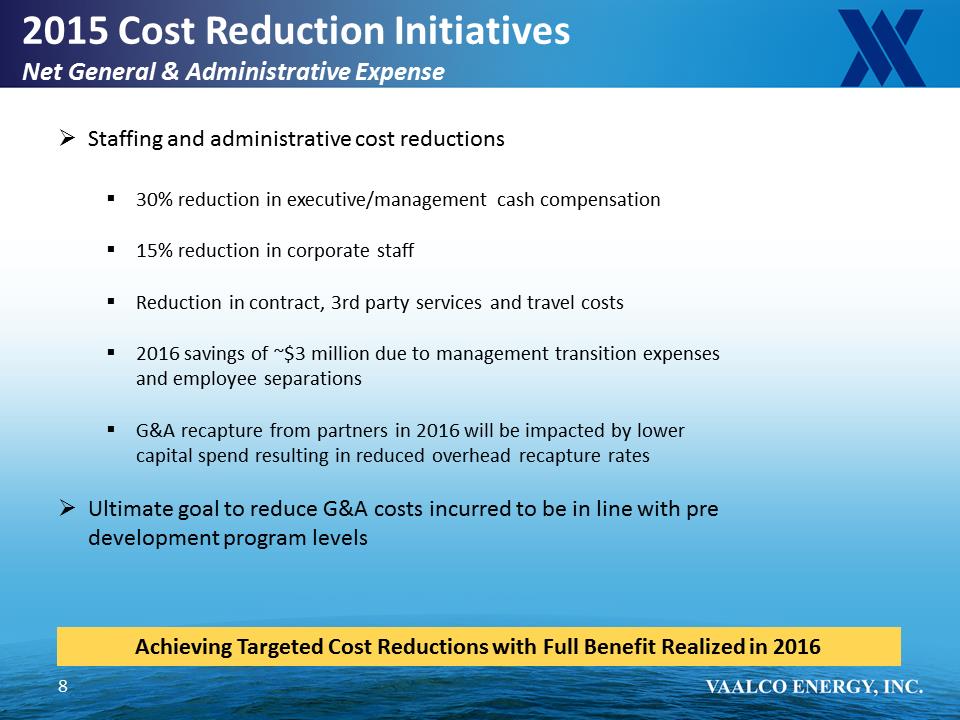
.Staffing and administrative cost reductions
.30% reduction in executive/management cash compensation
.15% reduction in corporate staff
.Reduction in contract, 3rd party services and travel costs
.2016 savings of ~$3 million due to management transition expenses
and employee separations
.G&A recapture from partners in 2016 will be impacted by lower
capital spend resulting in reduced overhead recapture rates
.Ultimate goal to reduce G&A costs incurred to be in line with pre
development program levels
Achieving Targeted Cost Reductions with Full Benefit Realized in 2016
Net General & Administrative Expense
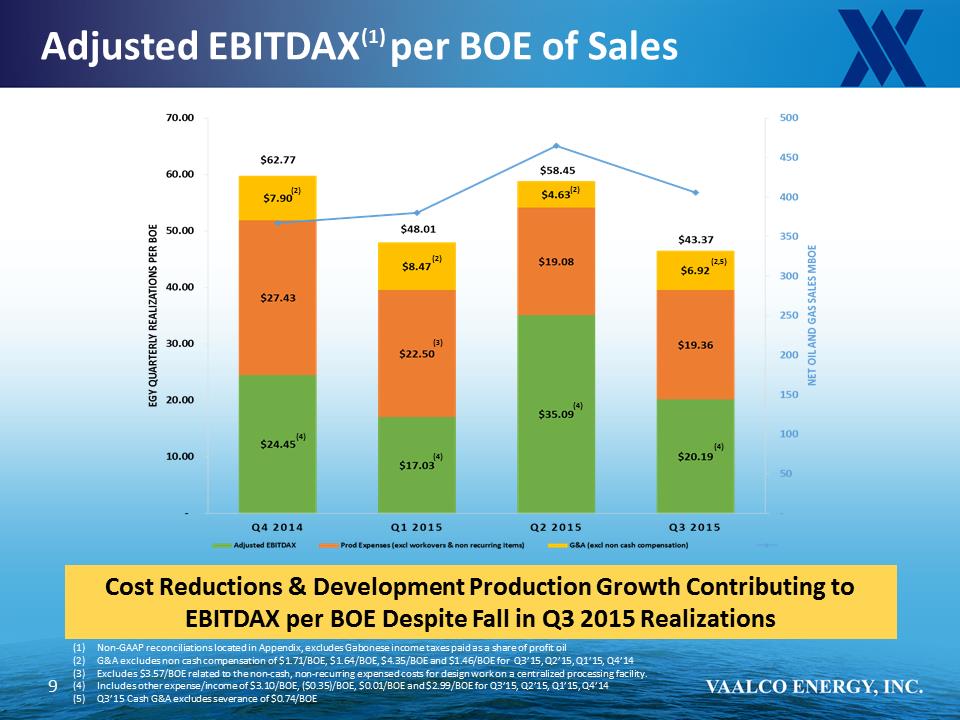
Cost Reductions & Development Production Growth Contributing to
EBITDAX per BOE Despite Fall in Q3 2015 Realizations
Adjusted EBITDAX(1) per BOE of Sales
9
(1)Non-GAAP reconciliations located in Appendix, excludes Gabonese income taxes paid as a share of profit oil
(2)G&A excludes non cash compensation of $1.71/BOE, $1.64/BOE, $4.35/BOE and $1.46/BOE for Q3’15, Q2’15, Q1’15, Q4’14
(3)Excludes $3.57/BOE related to the non-cash, non-recurring expensed costs for design work on a centralized processing facility.
(4)Includes other expense/income of $3.10/BOE, ($0.35)/BOE, $0.01/BOE and $2.99/BOE for Q3’15, Q2’15, Q1’15, Q4’14
(5)Q3’15 Cash G&A excludes severance of $0.74/BOE
10
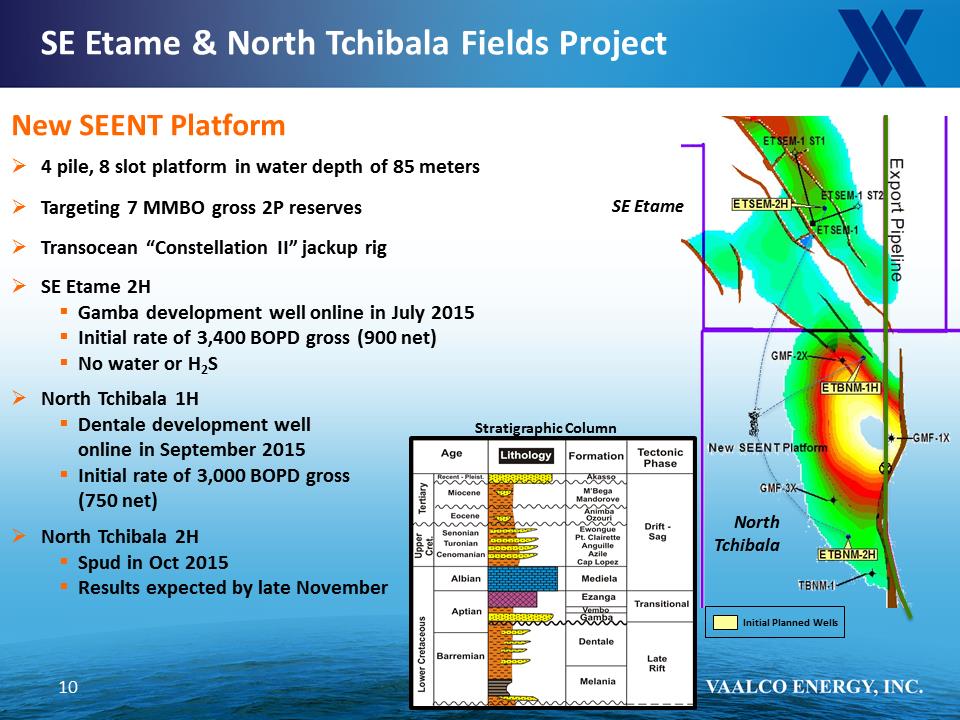
New SEENT Platform
.4 pile, 8 slot platform in water depth of 85 meters
.Targeting 7 MMBO gross 2P reserves
.Transocean “Constellation II” jackup rig
.SE Etame 2H
.Gamba development well online in July 2015
.Initial rate of 3,400 BOPD gross (900 net)
.No water or H2S
.North Tchibala 1H
.Dentale development well
online in September 2015
.Initial rate of 3,000 BOPD gross
(750 net)
.North Tchibala 2H
.Spud in Oct 2015
.Results expected by late November
11
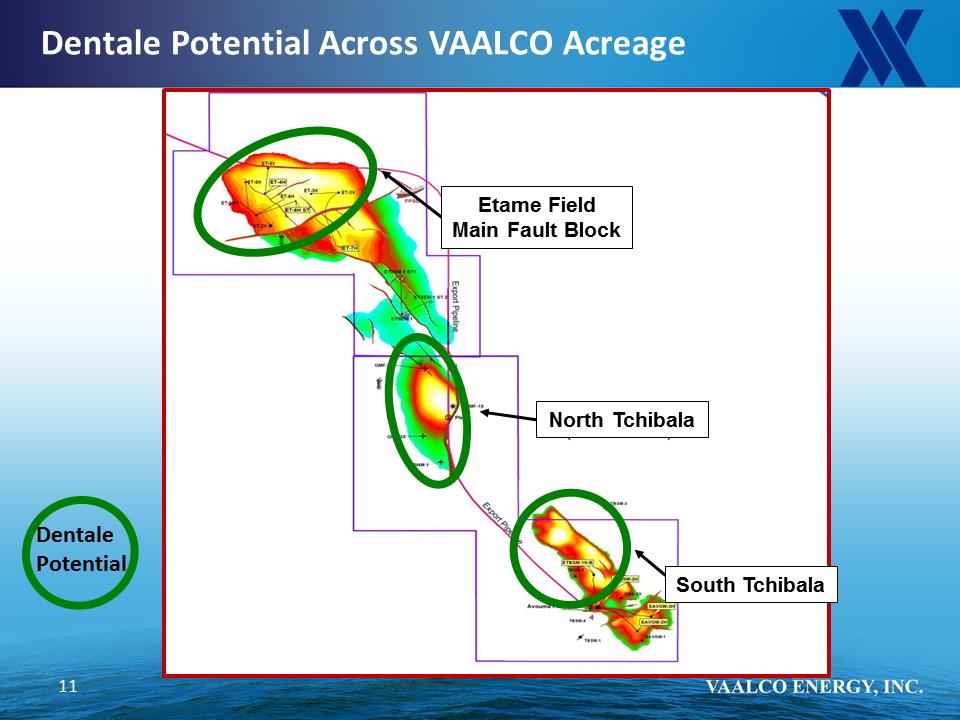
Dentale Potential Across VAALCO Acreage
Etame Field
Main Fault Block
North Tchibala
South Tchibala
Dentale
Potential
12
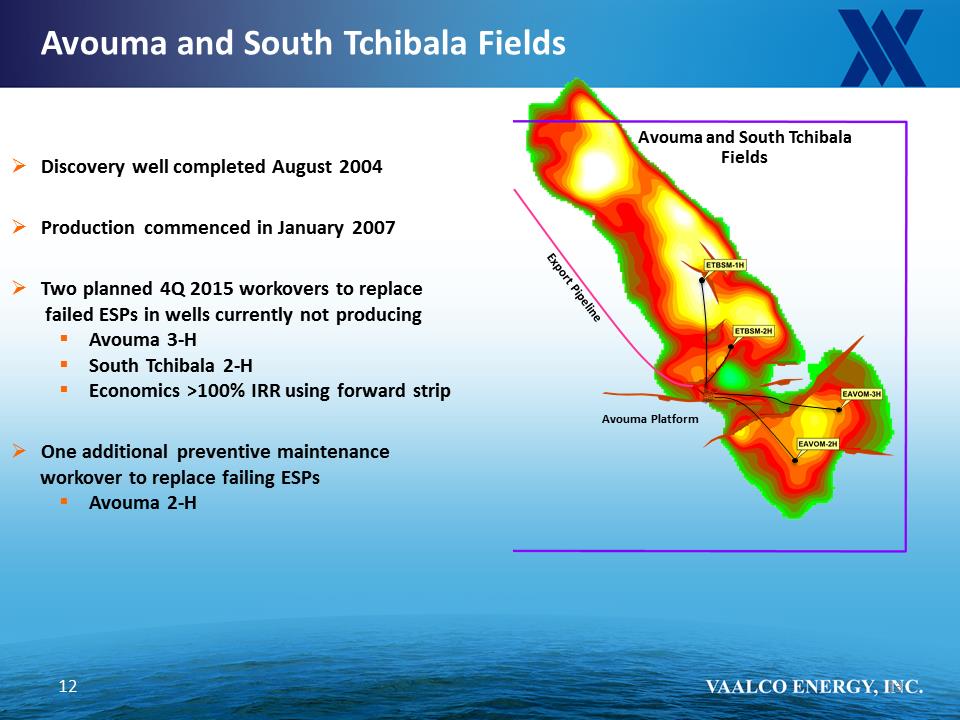
Avouma Platform
Avouma and South Tchibala
Fields
Export Pipeline
Avouma and South Tchibala Fields
Discovery well completed August 2004
.Production commenced in January 2007
Two planned 4Q 2015 workovers to replace
failed ESPs in wells currently not producing
.Avouma 3-H
.South Tchibala 2-H
.Economics >100% IRR using forward strip
.One additional preventive maintenance
workover to replace failing ESPs
.Avouma 2-H
13
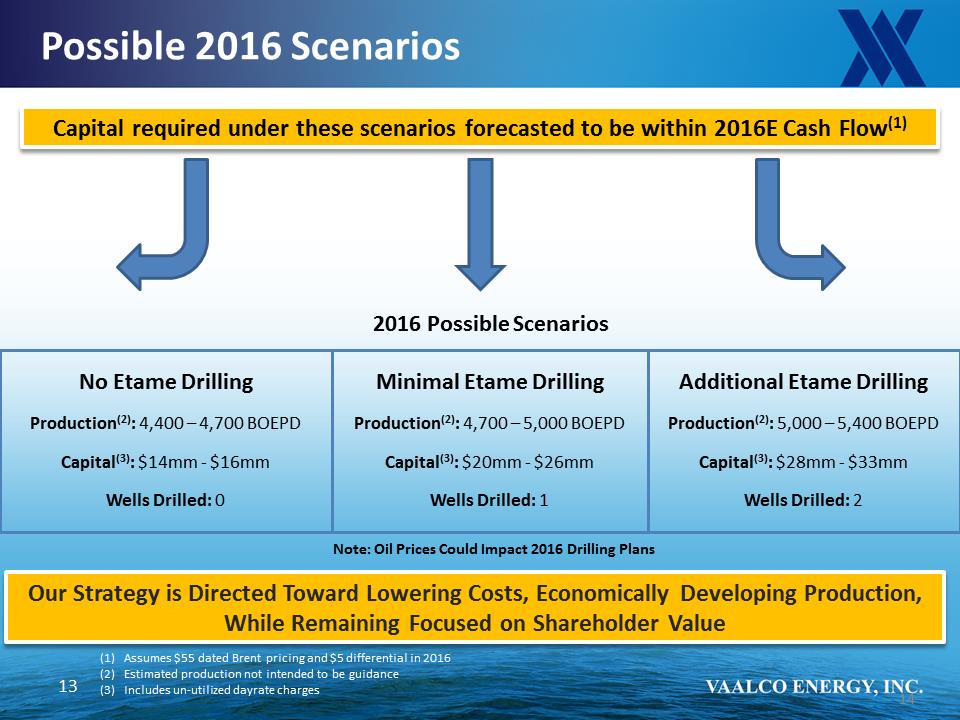
Additional Etame Drilling
Production(2): 5,000 – 5,400 BOEPD
Capital(3): $28mm - $33mm
Wells Drilled: 2
Minimal Etame Drilling
Production(2): 4,700 – 5,000 BOEPD
Capital(3): $20mm - $26mm
Wells Drilled: 1
No Etame Drilling
Production(2): 4,400 – 4,700 BOEPD
Capital(3): $14mm - $16mm
Wells Drilled: 0
2016 Possible Scenarios
14
Our Strategy is Directed Toward Lowering Costs, Economically Developing Production,
While Remaining Focused on Shareholder Value
Capital required under these scenarios forecasted to be within 2016E Cash Flow(1)
Possible 2016 Scenarios
(1)Assumes $55 dated Brent pricing and $5 differential in 2016
(2)Estimated production not intended to be guidance
(3)Includes un-utilized dayrate charges
14
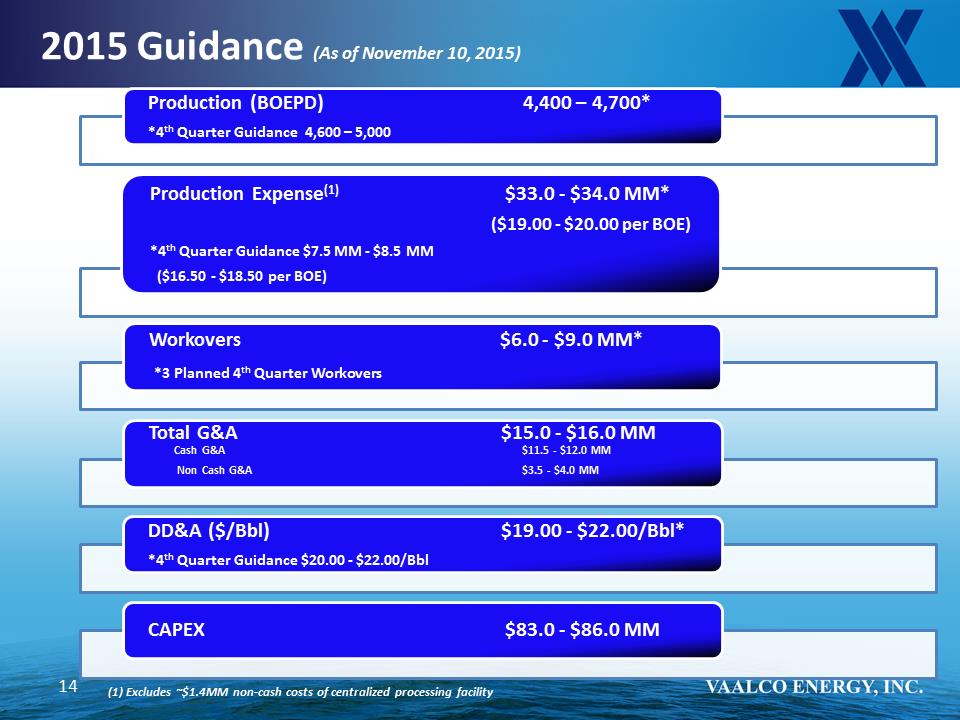
Production (BOEPD) 4,400 – 4,700*
*4th Quarter Guidance 4,600 – 5,000
Production Expense(1) $33.0 - $34.0 MM*
($19.00 - $20.00 per BOE)
*4th Quarter Guidance $7.5 MM - $8.5 MM
($16.50 - $18.50 per BOE)
Workovers $6.0 - $9.0 MM*
*3 Planned 4th Quarter Workovers
Total G&A $15.0 - $16.0 MM
Cash G&A $11.5 - $12.0 MM
Non Cash G&A $3.5 - $4.0 MM
DD&A ($/Bbl) $19.00 - $22.00/Bbl*
*4th Quarter Guidance $20.00 - $22.00/Bbl
CAPEX $83.0 - $86.0 MM
(1) Excludes ~$1.4MM non-cash costs of centralized processing facility
NYSE:EGY
Appendix
16
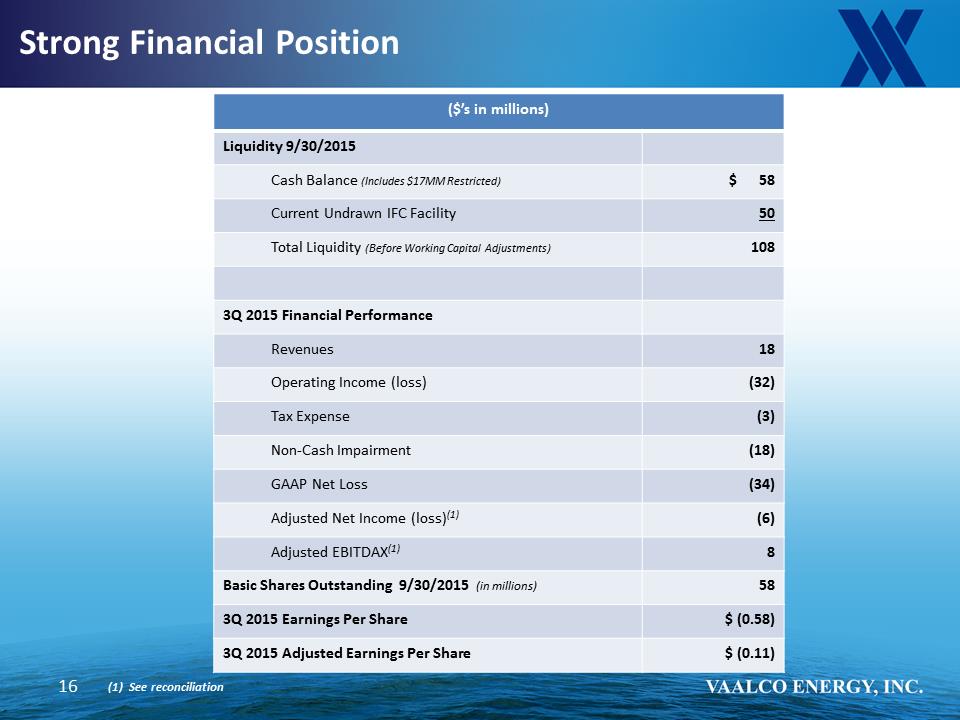
Strong Financial Position
($’s in millions)
Liquidity 9/30/2015
Cash Balance (Includes $17MM Restricted) $ 58
Current Undrawn IFC Facility
50
Total Liquidity (Before Working Capital Adjustments)
108
3Q 2015 Financial Performance
Revenues
18
Operating Income (loss)
(32)
Tax Expense
(3)
Non-Cash Impairment
(18)
GAAP Net Loss
(34)
Adjusted Net Income (loss)(1)
6)
8
Basic Shares Outstanding 9/30/2015 (in millions)
58
3Q 2015 Earnings Per Share
$ (0.58)
3Q 2015 Adjusted Earnings Per Share
$ (0.11)
(1) See reconciliation
17
Non-GAAP Measures
Adjusted EBITDAX is a supplemental non-GAAP financial measure used by VAALCO’s management and by external users of the Company’s financial statements, such as industry analysts, lenders, rating agencies, investors and others who follow the industry as an indicator of the Company’s ability to internally fund exploration and development activities and to service or incur additional debt. Adjusted EBITDAX is a non-GAAP financial measure and as used herein represents net income before interest income (expense) net, income tax expense, depletion, depreciation and amortization, impairment of proved properties, exploration expense and our other non-cash or unusual items of stock compensation expense and allowance for bad debts. Adjusted EBITDAX has significant limitations, including that it does not reflect the Company’s cash requirements for capital expenditures, contractual commitments, working capital or debt service. Adjusted EBITDAX should not be considered as a substitute for net income (loss), operating income (loss), cash flows from operating activities or any other measure of financial performance or liquidity presented in accordance with GAAP. Adjusted EBITDAX excludes some, but not all, items that affect net income (loss) and operating income (loss) and these measures may vary among other companies. Therefore, the Company’s Adjusted EBITDAX may not be comparable to similarly titled measures used by other companies.
Adjusted Net Loss excludes impairments of proved properties, non-operational adjustments, including impairment of proved properties and exploration expense on the onshore Gabon Mutamba Iroru discovery. Management uses this financial measure as an indicator of the Company’s operational trends and performance relative to other oil and natural gas companies and believes it is more comparable to earnings estimates provided by securities analysts. Adjusted Net Income is not a measure of financial performance under GAAP and should not be considered a substitute for loss applicable to common stockholders. The tables below reconcile the most directly comparable GAAP financial measures to Adjusted EBITDAX and Adjusted Net Income.
18
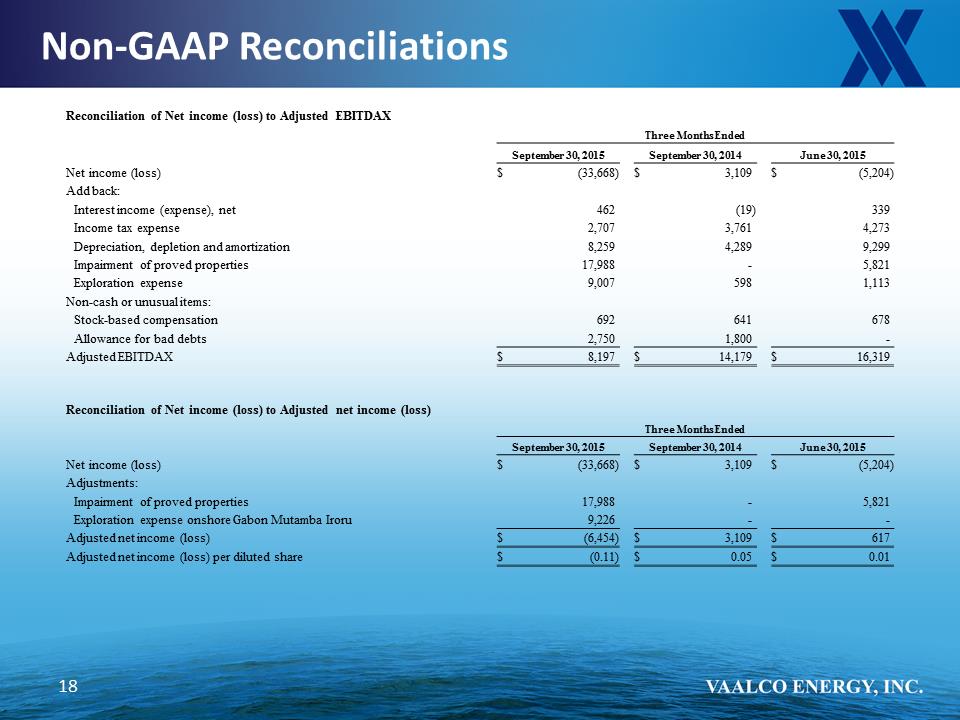
Non-GAAP Reconciliations
Three Months Ended September 30, 2015 September 30, 2014 June 30, 2015
Net income (loss)
$ (33,668)
5,204)
Add back:
Interest income (expense), net
462
(19)
339
Income tax expense
2,707
3,761
4,273
Depreciation, depletion and amortization
8,259
4,289
9,299
Impairment of proved properties
17,988
5,821
Exploration expense
9,007
598
1,113
Non-cash or unusual items:
Stock-based compensation
692
641
678
Allowance for bad debts
2,750
1,800
-
Adjusted EBITDAX
$ 8,197
$ 14,179
$ 16,319
Reconciliation of Net income (loss) to Adjusted net income (loss)
Three Months Ended
September 30, 2015
September 30, 2014
June 30, 2015
Net income (loss)
$ (33,668)
$ 3,109
$ (5,204)
Adjustments:
Impairment of proved properties
17,988
-
5,821
Exploration expense onshore Gabon Mutamba Iroru
9,226
-
-
Adjusted net income (loss)
$ (6,454)
$ 3,109
$ 617
Adjusted net income (loss) per diluted share
$ (0.11)
$ 0.05
$ 0.01