VAALCO ENERGY, INC.
TABLE OF CONTENTS
2
Glossary of Oil and Natural Gas Terms
Terms used to describe quantities of oil and natural gas
|
· |
Bbl — One stock tank barrel, or 42 U.S. gallons liquid volume, of crude oil or other liquid hydrocarbons. |
|
· |
BOE — One barrel of oil equivalent, converting natural gas to oil at the ratio of 6 Mcf of natural gas to 1 Bbl of oil. The ratio of six Mcf of natural gas to one Bbl of oil or natural gas liquids is commonly used in the oil and natural gas business and represents the approximate energy equivalency of natural gas to oil or liquids, and does not represent the sales price equivalency of natural gas to oil or liquids. Currently, the sales price of a Bbl of oil or natural gas liquids is significantly higher than the sales price of six Mcf of natural gas. |
|
· |
BOPD — One barrel of oil per day. |
|
· |
MBbl — One thousand Bbls. |
|
· |
MBOE— One thousand barrels of oil equivalent. |
|
· |
Mcf — One thousand cubic feet of natural gas. |
|
· |
MMbtu — One million British thermal units, a measure commonly used for natural gas pricing. |
|
· |
MMcf — One million cubic feet of natural gas. |
|
· |
MMBbl — One million Bbls. |
Terms used to describe the legal ownership of oil and natural gas properties
|
· |
Royalty interest — A real property interest entitling the owner to receive a specified portion of the gross proceeds of the sale of oil and natural gas production or, if the conveyance creating the interest provides, a specific portion of oil and natural gas produced, without any deduction for the costs to explore for, develop or produce the oil and natural gas. |
|
· |
Working interest — A real property interest entitling the owner to receive a specified percentage of the proceeds of the sale of oil and natural gas production or a percentage of the production, but requiring the owner of the working interest to bear the cost to explore for, develop and produce such oil and natural gas. A working interest owner who owns a portion of the working interest may participate either as operator or by voting his percentage interest to approve or disapprove the appointment of an operator and drilling and other major activities in connection with the development and operation of a property. |
Terms used to describe interests in wells and acreage
|
· |
Gross oil and natural gas wells or acres — Gross wells or gross acres represent the total number of wells or acres in which a working interest is owned, before consideration of the ownership percentage. |
|
· |
Net oil and natural gas wells or acres — Determined by multiplying “gross” wells or acres by the owned working interest. |
Terms used to classify reserve quantities
|
· |
Developed oil and natural gas reserves — Developed oil and natural gas reserves are reserves of any category that can be expected to be recovered: |
(i) Through existing wells with existing equipment and operating methods or in which the cost of the required equipment is relatively minor compared to the cost of a new well; and
(ii) Through installed extraction equipment and infrastructure operational at the time of the reserves estimate if the extraction is by means not involving a well.
|
· |
Proved oil and natural gas reserves — Proved oil and natural gas reserves are those quantities of oil and natural gas, which, by analysis of geoscience and engineering data, can be estimated with reasonable certainty to be economically producible (from a given date forward, from known reservoirs, and under existing economic conditions, operating methods, and government regulations) prior to the time at which contracts providing the right to operate expire, unless evidence indicates that renewal is reasonably certain, regardless of whether deterministic or probabilistic methods are used for the estimation. The project to extract the hydrocarbons must have commenced or the operator must be reasonably certain that it will commence the project within a reasonable time. |
(i) The area of the reservoir considered as proved includes:
(A) The area identified by drilling and limited by fluid contacts, if any, and
(B) Adjacent undrilled portions of the reservoir that can, with reasonable certainty, be judged to be continuous with it and to contain economically producible oil or natural gas on the basis of available geoscience and engineering data.
3
(ii) In the absence of data on fluid contacts, proved quantities in a reservoir are limited by the lowest known hydrocarbons (LKH) as seen in a well penetration unless geoscience, engineering, or performance data and reliable technology establishes a lower contact with reasonable certainty.
(iii) Where direct observation from well penetrations has defined a highest known oil (HKO) elevation and the potential exists for an associated natural gas cap, proved oil reserves may be assigned in the structurally higher portions of the reservoir only if geoscience, engineering, or performance data and reliable technology establish the higher contact with reasonable certainty.
(iv) Reserves which can be produced economically through application of improved recovery techniques (including, but not limited to, fluid injection) are included in the proved classification when:
(A) Successful testing by a pilot project in an area of the reservoir with properties no more favorable than in the reservoir as a whole, the operation of an installed program in the reservoir or an analogous reservoir, or other evidence using reliable technology establishes the reasonable certainty of the engineering analysis on which the project or program was based; and
(B) The project has been approved for development by all necessary parties and entities, including governmental entities.
(v) Existing economic conditions include prices and costs at which economic producibility from a reservoir is to be determined. The price shall be the average price during the 12-month period prior to the ending date of the period covered by the report, determined as an unweighted arithmetic average of the first-day-of-the-month price for each month within such period, unless prices are defined by contractual arrangements, excluding escalations based upon future conditions.
|
· |
Reserves — Reserves are estimated remaining quantities of oil and natural gas and related substances anticipated to be economically producible, as of a given date, by application of development projects to known accumulations. In addition, there must exist, or there must be a reasonable expectation that there will exist, the legal right to produce or a revenue interest in the production, installed means of delivering oil and natural gas or related substances to market, and all permits and financing required to implement the project. |
|
· |
Undeveloped oil and natural gas reserves — Undeveloped oil and natural gas reserves are reserves of any category that are expected to be recovered from new wells on undrilled acreage, or from existing wells where a relatively major expenditure is required for recompletion. |
(i) Reserves on undrilled acreage shall be limited to those directly offsetting development spacing areas that are reasonably certain of production when drilled, unless evidence using reliable technology exists that establishes reasonable certainty of economic producibility at greater distances.
(ii) Undrilled locations can be classified as having undeveloped reserves only if a development plan has been adopted indicating that they are scheduled to be drilled within five years, unless the specific circumstances, justify a longer time.
(iii) Under no circumstances shall estimates for undeveloped reserves be attributable to any acreage for which an application of fluid injection or other improved recovery technique is contemplated, unless such techniques have been proved effective by actual projects in the same reservoir or an analogous reservoir, or by other evidence using reliable technology establishing reasonable certainty.
|
· |
Unproved properties — Properties with no proved reserves. |
Terms used to assign a present value to reserves
|
· |
Standardized measure — Standardized measure is the present value, discounted at an annual rate of 10%, of estimated future net revenues to be generated from the production of proved reserves, determined in accordance with the rules and regulations of the Securities and Exchange Commission, using prices and costs in effect as of the date of estimation, without giving effect to non–property related expenses such as certain general and administrative expenses, debt service or to depreciation, depletion and amortization. |
Terms used to describe seismic operations
|
· |
Seismic data — Oil and natural gas companies use seismic data as their principal source of information to locate oil and natural gas deposits, both to aid in exploration for new deposits and to manage or enhance production from known reservoirs. To gather seismic data, an energy source is used to send sound waves into the subsurface strata. These waves are reflected back to the surface by underground formations, where they are detected by geophones which digitize and record the reflected waves. Computers are then used to process the raw data to develop an image of underground formations. |
|
· |
2-D seismic data. — 2-D seismic survey data has been the standard acquisition technique used to image geologic formations over a broad area. 2-D seismic data is collected by a single line of energy sources which reflect seismic waves to a single line of geophones. When processed, 2-D seismic data produces an image of a single vertical plane of sub-surface data. |
4
|
· |
3-D seismic data — 3-D seismic data is collected using a grid of energy sources, which are generally spread over several miles. A 3-D survey produces a three dimensional image of the subsurface geology by collecting seismic data along parallel lines and creating a cube of information that can be divided into various planes, thus improving visualization. Consequently, 3-D seismic data is a more reliable indicator of potential oil and natural gas reservoirs in the area evaluated. |
FORWARD-LOOKING STATEMENTS
This report includes “forward-looking statements” within the meaning of Section 27A of the Securities Act of 1933, as amended, and Section 21E of the Securities Exchange Act of 1934, as amended, (the “Exchange Act”) which are intended to be covered by the safe harbors created by those laws. We have based these forward-looking statements on our current expectations and projections about future events. These forward-looking statements include information about possible or assumed future results of our operations. All statements, other than statements of historical facts, included in this report that address activities, events or developments that we expect or anticipate may occur in the future, including without limitation, statements regarding our financial position, operating performance and results, reserve quantities and net present values, market prices, business strategy, derivative activities, the amount and nature of capital expenditures, plans and objectives of management for future operations are forward-looking statements. When we use words such as “anticipate,” “believe,” “estimate,” “expect,” “intend,” “forecast,” “outlook,” “aim,” “will,” “could,” “should,” “may,” “likely ,” “plan,” “probably” or similar expressions, we are making forward-looking statements. Many risks and uncertainties that could affect our future results and could cause results to differ materially from those expressed in our forward-looking statements include, but are not limited to:
|
· |
our ability to continue as a going concern; |
|
· |
further declines, volatility of and weakness in oil and natural gas prices; |
|
· |
our ability to maintain liquidity in view of current oil and natural gas prices; |
|
· |
further reductions in the borrowing base and our ability to meet the financial covenants of our revolving credit facility; |
|
· |
the uncertainty of estimates of oil and natural gas reserves; |
|
· |
the impact of competition; |
|
· |
the availability and cost of seismic, drilling and other equipment; |
|
· |
operating hazards inherent in the exploration for and production of oil and natural gas; |
|
· |
difficulties encountered during the exploration for and production of oil and natural gas; |
|
· |
difficulties encountered in measuring, transporting and delivering oil to commercial markets; |
|
· |
discovery, acquisition, development and replacement of oil and natural gas reserves; |
|
· |
timing and amount of future production of oil and natural gas; |
|
· |
hedging decisions, including whether or not to enter into derivative financial instruments; |
|
· |
our ability to effectively integrate companies and properties that we acquire; |
|
· |
general economic conditions, including any future economic downturn, disruption in financial markets and the availability of credit; |
|
· |
changes in customer demand and producers’ supply; |
|
· |
future capital requirements and our ability to attract capital; |
|
· |
currency exchange rates; |
|
· |
actions by the governments of and events occurring in the countries in which we operate; |
|
· |
actions by our venture partners; |
|
· |
compliance with, or the effect of changes in, governmental regulations regarding our exploration, production, and well completion operations including those related to climate change; |
|
· |
the outcome of any governmental audit; |
|
· |
actions of operators of our oil and natural gas properties; and |
|
· |
weather conditions. |
The information contained in this report, including the information set forth under the heading “Item 1A. Risk Factors,” identifies additional factors that could cause our results or performance to differ materially from those we express in forward-looking statements. Although we believe that the assumptions underlying our forward-looking statements are reasonable, any of these assumptions and therefore also the forward-looking statements based on these assumptions, could themselves prove to be inaccurate. In light of the significant uncertainties inherent in the forward-looking statements which are included in this report, our inclusion of this information is not a representation by us or any other person that our objectives and plans will be achieved. When you consider our forward-looking statements, you should keep in mind these risk factors and the other cautionary statements in this report.
Our forward-looking statements speak only as of the date made, and we will not update these forward-looking statements unless the securities laws require us to do so. Our forward-looking statements are expressly qualified in their entirety by this cautionary statement. In light of these risks, uncertainties and assumptions, any forward-looking events discussed in this report may not occur.
5
BACKGROUND
VAALCO Energy, Inc. is a Delaware corporation, incorporated in 1985 and headquartered at 9800 Richmond Avenue, Suite 700, Houston, Texas 77042: telephone number is (713) 623-0801 and the website is www.vaalco.com. Consolidated subsidiaries are VAALCO Gabon (Etame), Inc., VAALCO Production (Gabon), Inc., VAALCO Angola (Kwanza), Inc., VAALCO UK (North Sea), Ltd., VAALCO International, Inc., VAALCO Energy (EG), Inc., VAALCO Energy Mauritius (EG) Limited and VAALCO Energy (USA), Inc. As used in this Annual Report on Form 10-K, the terms, “we”, “us”, “our”, and “VAALCO” mean VAALCO Energy, Inc. and its consolidated subsidiaries, unless the context otherwise requires.
VAALCO is a Houston-based independent energy company principally engaged in the acquisition, exploration, development and production of crude oil and natural gas. We own producing properties and conduct exploration activities as operator in Gabon, West Africa; we conduct exploration activities as an operator in Angola, West Africa, and we participate in exploration and development activities as a non-operator in Equatorial Guinea, West Africa. In the United States (“U.S.”), we operate unconventional resource properties in North Texas and hold undeveloped leasehold acreage in Montana. We also own minor interests in conventional production activities as a non-operator in the U.S.
STRATEGY
Our strategy has been significantly impacted by the current commodity price environment, in which we have experienced unprecedented oil price declines beginning in the fall of 2014. These price declines have had, and will likely continue to have, a material adverse impact on our cash flows, results of operations and liquidity. As a result of these price declines and significant uncertainties regarding our liquidity, we have substantially adjusted our strategic focus. The consequences of these uncertainties, and our plans to address them, are described in Item 7. “Management’s Discussion and Analysis of Financial Condition and Results of Operations — Current Developments,” “ —Going Concern” and “–Capital Resources and Liquidity,” and Note 2 to the consolidated financial statements included in Part III, Item 8 – “Financial Statements and Supplementary Data.” See also Item 1A. “Risk Factors – Due to our substantial liquidity concerns, we may be unable to continue as a going concern.”
If oil and natural gas prices continue to remain at the current depressed levels, we expect that for 2016 we will not generate adequate revenue to cover our operating expenses, we will generate losses from operations, and our cash flows will not be sufficient to cover our operating expenses. In addition, we experienced significant negative revisions to our estimated proved reserves based upon this low pricing environment. The low oil and natural gas prices affected the economic feasibility of developing our proved undeveloped reserves. These circumstances lead to the reclassification of certain of our resources from proved undeveloped reserves to unproved, which could have material adverse implications for the value of our company, cash flows, access to capital, liquidity and financial condition.
In 2016, we embarked on a strategic alternatives initiative designed to identify and execute on that option which is most likely to result in the greatest value for our shareholders. We are considering multiple alternatives, including, but not limited to, additional debt or equity financing, a sale or farm-down of assets, delay of the discretionary portion of our capital spending to future periods, operating cost reductions, joint ventures and a potential sale or merger. The Board of Directors has formed a strategic committee to oversee the evaluation of our strategic alternatives. In addition, we have engaged Scotia Capital (USA) Inc. as financial advisor. We plan to secure funds necessary to continue as a going concern. However, our current cash position and our ability to access additional capital may limit our available opportunities or not provide sufficient cash for operations and there can be no guarantee of future capital acquisition or fundraising success. We are focused on a financially driven operating strategy while pursuing strategic growth opportunities.
Financially Driven Operating Strategy
|
· |
Maximize cash flow and preserve cash balance |
|
o |
Sell our production at the best price possible |
|
· |
Manage capital expenditures and liquidity |
|
o |
Revolving credit facility borrowing base of $20.1 million with $15 million drawn at December 31, 2015 |
|
o |
Identify new sources of liquidity to bolster our balance sheet and fund new opportunities |
|
o |
Optimize our 2016 capital efficiency, including release of the Constellation II rig and reducing our capital budget to a range of $3 million to $6 million |
|
· |
Focus on maintaining production and lowering costs to increase margins and preserve optionality to capitalize on a rebound in prices |
|
o |
Transition from the development drilling campaign to efficient production operations |
|
o |
Optimize production through careful management of wells and infrastructure |
|
o |
Further reduce field-level costs |
|
o |
Continue to lower administrative costs |
6
Strategic Alternative Opportunities
|
· |
Identify viable acquisition targets and/or merger opportunities |
|
· |
Consider joint ventures that allow us to leverage our operating capabilities and proven West Africa experience |
|
· |
Obtain external funding necessary for growth opportunities and maintaining our liquidity |
|
· |
Solicit offers to purchase any and all assets, including a corporate sale |
We believe that we have strong management and technical expertise specific to West Africa which gives us an advantage when looking at growth opportunities in this region:
|
· |
Excellent reputation as a West Africa operator; |
|
· |
History of establishing favorable operating relationships with host governments and local partners; |
|
· |
Subsurface knowledge of key plays and risks in the broader regional framework of discoveries and fields; |
|
· |
Operational capacity to take on new development projects; |
|
· |
Familiarity with local practices and infrastructure; |
|
· |
Proven abilities to identify international opportunities; and |
|
· |
Market intelligence to provide insight into available opportunities early. |
SEGMENT AND GEOGRAPHIC INFORMATION
For operating segment and geographic financial information, see Note 13 to the consolidated financial statements which begin on page F-1.
Gabon Segment
Offshore – Etame Marin Block
Our most significant asset, which accounts for the majority of our revenues, is the Etame Production Sharing Contract (“PSC”), which was signed in 1995, related to the Etame Marin block located offshore the Republic of Gabon (“Gabon”). The Etame Marin block covers an area of approximately 28,700 gross acres and consists of subsalt reservoirs that lie 20 miles offshore in water depths of approximately 250 feet. The Etame, Avouma/South Tchibala, Ebouri, Southeast Etame and North Tchibala fields are included in the block. Our working interest in the Etame Marin block is 28.1%, and we operate it on behalf of a consortium of five companies. The development is subject to a 7.5% back-in interest by the Government of Gabon which they assigned to a third party.
Development
In late 2012, we and our partners approved a development plan, consisting of two new platforms and a multi-well development drilling campaign. The drilling campaign included drilling three development wells from the Etame platform, three development wells from the Southeast Etame/North Tchibala (“SEENT”) platform and workovers of existing wells in the Etame Marin block.
In May 2014, we contracted the Constellation II drilling rig to use in the development drilling campaign. Following the installation of the Etame and SEENT platforms in the third quarter of 2014, we commenced drilling the first well, the Etame 8-H, in November 2014 from the Etame platform. In December 2014, we shut-in the Etame 8-H well after determining that it was producing hydrogen sulfide (“H2S”). See “Hydrogen Sulfide Impact” below. In 2015, two new development wells were drilled and brought on production from the Etame platform. The Etame 10-H well was brought on production in the first quarter of 2015, and the Etame 12-H well, which began drilling in March 2015, was brought on production in the second quarter of 2015. We moved the rig early in the second quarter of 2015 to the SEENT platform. Three new development wells were drilled and brought on production from the SEENT platform in 2015: the Southeast Etame 2-H, the North Tchibala 1-H and the North Tchibala 2-H. All the wells brought online subsequent to the Etame 8-H have not produced H2S. The two wells in the North Tchibala field are the first offshore Gabon wells to produce from the Dentale formation. The rig was moved to the Avouma platform in December 2015 to perform workovers on three wells: South Tchibala 2-H, Avouma 3-H and Avouma 2-H. At the end of 2015, one workover had been completed successfully and the second was underway. In January 2016, the workover campaign was complete. The South Tchibala 2-H was restored to production after being offline since August 2014, and the Avouma 2-H well resumed production at an increased rate. The Avouma 3-H, which was not on production prior to the workover, has been suspended and secured for future use. During the workover operations on the Avouma 3-H, the downhole equipment became lodged in the wellbore with efforts to remove it proving unsuccessful. In 2016, we released the Constellation II rig and no longer intend to drill any wells in 2016 on our Etame Marin block offshore Gabon. We expect to incur costs of up to $7 million related to the contract period from the rig release date through its expiration, for which a liability will be recognized in the first quarter of 2016.
Production
Production operations in the Etame Marin block include 12 wells from four platforms, plus three subsea wells across all fields tied back by pipelines to deliver oil and associated natural gas through a riser system to allow for delivery, processing, storage and ultimately offloading the oil from a leased Floating, Production, Storage and Offloading vessel (“FPSO”) anchored to the seabed on the block. With the FPSO limitations of approximately 25,000 BOPD and 30,000 barrels of total fluids per day, the challenge is to optimize production on both a near and long-term basis subject to investment and operational agreements between VAALCO and the consortium. During 2015 and 2014, aggregate production from the block was approximately 6.8 MMBbls (1.7 MMBbls net to us) and 5.8 MMBbls (1.4
7
MMBbls net to us), respectively. Our net share of barrels produced reflects an allocation of cost oil and profit oil, after reduction for a royalty of approximately 13%.
Etame field – In 2001, the government of Gabon awarded VAALCO and its partners a 12,000 gross acre exploitation area for development of the Etame field. The exploitation area has a term of 20 years through June 2021 (a ten year primary term followed by two subsequent five year renewals) and also includes the Southeast Etame field which is discussed below. The Etame field was originally developed with a total of six subsea wells connected to the FPSO. In the third quarter of 2014, we completed the installation of a new platform on the field and in the fourth quarter of 2014 commenced the development drilling campaign discussed above which included the drilling of three wells in the Etame field. There are currently five wells producing in the Etame field.
Avouma/South Tchibala field – In 2005, the government of Gabon awarded VAALCO and its partners a 13,000 gross acre exploitation area for the joint development of the Avouma/South Tchibala field. The exploitation area has a term of 20 years through March 2025 (a ten year primary term followed by two subsequent five year renewals). In 2006, we installed a platform at the Avouma/South Tchibala field and subsequently drilled four development wells. At December 31, 2015, three wells were producing, and a workover was underway on the fourth well. As discussed above, the workover of the Avouma 3-H was unsuccessful, and it remains off production in 2016.
Ebouri field – We drilled the Ebouri discovery well in January 2004. As a result of this discovery well, in 2006, the government of Gabon awarded VAALCO and its partners a 3,700 gross acre exploitation area for the development of the Ebouri field. The exploitation area has a term of 20 years through July 2026 (a ten year primary term followed by two subsequent five year renewals). A platform was installed in July 2008 and three development wells were drilled and completed over the following two years. Currently one well in the Ebouri field is producing; the other two wells were shut-in for safety and marketability reasons in 2012 when the presence of H 2 S was discovered. See “Hydrogen Sulfide Impact” below.
Southeast Etame field – The Southeast Etame 2-H well was brought on production in July 2015. It required re-drilling a segment of the well following a mechanical failure while drilling. The Southeast Etame 2-H well was drilled to develop an exploration discovery made in 2010. The well came on-line producing in excess of 3,000 gross BOPD.
North Tchibala field –The North Tchibala 1-H well, targeting the Dentale formation also required re-drilling a segment of the well due to wellbore collapse during drilling. It was brought on production in mid-September 2015 at an initial rate of approximately 3,000 gross BOPD and is currently producing at approximately 1,500 BOPD. Oil discoveries were made in the North Tchibala field in the Dentale formation prior to our acquisition of the Etame Marin block in 1995. The North Tchibala 2-H, our second well drilled to the Dentale formation, was brought on production in December 2015 at an initial rate of approximately 500 gross BOPD.
Hydrogen Sulfide Impact
Four of our wells are currently shut-in for safety and marketability reasons because H2S was present in their production. In July 2012, we discovered the presence of H2S from two of the three producing wells in the Ebouri field (the Ebouri 3-H and Ebouri 4-H wells), and these wells were shut-in. In addition, H2S was first detected in January 2014 and later confirmed in July 2014 in the Etame 5-H well in the Etame field. The Etame 8-H well was drilled in the fourth quarter of 2014 and testing in the first quarter of 2015 confirmed the presence of H2S. Both the Etame 5-H and 8-H wells remain shut-in. No well drilled after the Etame 8-H has produced H2S.
To re-establish and maximize production from the impacted areas, additional capital investment will be required, including one or more processing facilities capable of removing H2S, recompletion of the temporarily abandoned wells and potentially drilling additional wells. We evaluated fifteen alternatives which were ranked and high-graded. None of the alternatives were deemed economic at current forecasted oil prices, but we believe economic alternatives are available should oil prices recover sufficiently. In 2015, a total of $1.9 million related to project design and evaluation was charged to expense. As of December 31, 2015, we have no proved reserves booked for the wells impacted by H2S, and their removal generated a 1,440 MBOE downward revision of our net proved reserves as compared to December 31, 2014.
Exploration
At December 31, 2015, we have no undeveloped leasehold costs related to Etame Marin block. The sixth extension period of the exploration acreage on this block expired at the end of July 2014, with us having fully met all of the obligations under its terms.
Abandonment
As part of securing the first of two five-year extensions to the Etame field production license to which we were entitled from the government of Gabon, we agreed to a cash funding arrangement for the eventual abandonment of all offshore wells, platforms and facilities on the Etame Marin block. The agreement was finalized in the first quarter of 2014 (effective 2011) providing for annual funding over a period of ten years at 12.14% of the total abandonment estimate for the first seven years with the remaining unfunded estimated costs spread over the last three years of the production license.
We are required under the Etame production sharing contract to conduct abandonment studies to update the amounts being funded for the eventual abandonment of the offshore wells, platforms and facilities on the Etame Marin block. In January 2016, we completed a new abandonment study. Due to two new platforms and to the development wells drilled since the prior study, the amounts necessary to fund future abandonment obligations increased. This increased the abandonment estimate used for funding purposes from $10.1 million net to
8
VAALCO on an undiscounted basis to $17.2 million, and in turn the annual abandonment requirements net to VAALCO are expected to be $2.6 million in 2016, $2.1 million in 2017 and 2018, and $1.3 million per year for 2019 to 2021.
The abandonment estimate used for this purpose is approximately $61.1 million ($17.2 million net to VAALCO) on an undiscounted basis. Through December 31, 2015, $18.3 million ($5.1 million net to VAALCO) on an undiscounted basis has been funded. The amounts paid are reimbursable through the cost account and are non-refundable. The obligation for abandonment of the Gabon offshore facilities is included in the Asset retirement obligation shown on our consolidated balance sheet. This cash funding is reflected under other long term assets as Abandonment funding on our consolidated balance sheet.
Impairment
In the fourth quarter of 2014, we recorded an impairment loss of $98.3 million to write down our investment in certain fields comprising the Etame Marin block to fair value as a result of the declines in the forecasted oil prices used in the impairment testing and calculation. We recorded impairments each quarter of 2015 totaling $81.3 million for 2015 to write down our investment in all fields comprising the Etame Marin block, as well as various U.S. fields, primarily as a result of lower forecasted oil prices as well as higher costs for planned development wells used in the impairment evaluation. See Note 5 to the consolidated financial statements for further discussion of impairments.
Onshore – Mutamba Iroru Block
In November 2005, we signed a PSC for the Mutamba Iroru block onshore Gabon. Under the five year contract we were awarded exploration rights to approximately 270,000 acres along the central coast of Gabon. We have a 50% operated working interest in the block (41% net working interest assuming Gabon exercises its back-in rights). After drilling two unsuccessful exploration wells on the block in 2009, we entered into a farmout agreement with Total Gabon to continue the exploration activities. Following seismic reprocessing, we drilled the N’Gongui No. 2 discovery well in 2012.
Since mid-2014, we have been working to finalize a revised or new PSC with the government of Gabon to allow for development of the discovery and to maintain exploration rights on the block. A term sheet, which specifies financial and other obligations to be included in a new PSC, was signed in the third quarter of 2014.
A letter received in September 2015 from the Gabon government expressed their view that the initial PSC has expired and encouraged us to expeditiously enter into a new PSC under the terms of the signed term sheet which, among other factors, honors the 2012 discovery and the accumulated cost account which is used in the calculation of Gabon production taxes. We and our joint venture partner do not agree with the government’s assertion that the initial PSC has expired.
Meetings were held in October 2015 with the government regarding further amendments to the previously agreed terms of a new PSC, taking into account the substantial decrease in oil prices compared to the price environment when the term sheet was signed in the third quarter of 2014. We also met with the joint venture partner in October 2015 and continue to have discussions on the matter.
We can provide no assurance that we will enter into a new PSC. We can provide no assurances as to either the approval of the PSC by the Government of Gabon, or the subsequent approval of a development area by the Government of Gabon. As discussed further in Note 5 to the consolidated financial statements, the September 30, 2015 evaluation of the economic viability of the N’Gongui No. 2 well resulted in a determination that the costs no longer met the necessary criteria for suspended well costs, and accordingly we included the costs in exploration expense in the third quarter of 2015.
Angola Segment
Offshore –Block 5
In November 2006, we signed a production sharing contract for Block 5, offshore Angola. The four year primary term, with an optional three year extension, awarded us exploration rights to 1.4 million acres offshore central Angola. VAALCO’s working interest is 40%. Additionally, we are required to carry the Angolan national oil company, Sonangol P&P, for 10% of the work program. During the first four years of the contract, we were required to acquire and process seismic data and drill two exploration wells. The seismic commitments were met within the time period, but the wells were not drilled due to partner non-performance.
The government-assigned working interest partner was delinquent in paying their share of the costs several times in 2009 and consequently was placed in a default position. By a governmental decree dated December 1, 2010, the delinquent partner was removed from the production sharing contract, and a one year time extension was granted for drilling the two exploration commitment wells. Additional extensions were subsequently granted by the Angolan government until November 30, 2014 to drill the two exploration commitment wells.
In the fourth quarter of 2013, we received a written confirmation from The Ministry of Petroleum of Angola that the available 40% working interest in Block 5, offshore Angola, had been assigned to Sonangol E.P., the National Concessionaire. The Ministry of Petroleum also confirmed that Sonangol E.P. would assign the aforementioned participating interest to its exploration and production affiliate, Sonangol P&P. The assignment was made effective on January 1, 2014. Sonangol EP and Sonangol P&P agree that the unpaid amounts from the defaulted partner plus the amounts incurred on the partner’s behalf during the period prior to assignment of the working interest to Sonangol P&P are the responsibility of Sonangol P&P. We invoiced Sonangol P&P for these amounts totaling $7.6 million plus interest in April 2014. Due to the uncertainty of collection, we recorded a full allowance totaling $7.6 million during 2011 through 2013 for the amount owed. Because this amount continued to be owed and due to slow payment history of the monthly cash call
9
invoices since their assignment date of January 1, 2014, we placed Sonangol P&P in default in the first quarter of 2015. Sonangol E.P. acknowledged the legitimacy of the amounts owed and pledged to work to bring the Sonangol P&P account to a current status.
On March 14, 2016, we received $19.0 million from Sonangol P&P as payment for the full amounts owed as of December 31, 2015, which included: (i) $8.1 million of partner receivables reported at December 31, 2015 (representing 2015 activity), (ii) the $7.6 million of unpaid costs assumed by Sonangol P&P when they were assigned the participating interest in January 2014, and (iii) $3.2 million of interest as a result of being in default which we have not previously recognized in our financial results. As of December 31, 2015, we had $8.1 million reflected in Accounts with partners, net of an allowance of $7.6 million. As a result of this payment received subsequent to December 31, 2015, net income (loss) for the first quarter of 2016 will reflect the benefit for the reversal of the $7.6 million allowance and the recognition of the $3.2 million of default interest.
Although Sonangol P&P’s payment in March 2016 resolves the long outstanding amounts owed, there continues to be uncertainty about the future exploration of Block 5. To date, we have not been successful in farming-down part of our interest in Block 5 and our current liquidity is preventing us from pursuing the project without a partner. Due to the above circumstances regarding our intent and ability to pursue further exploration activities in Angola, we are recording a full impairment totaling $8.2 million of our undeveloped leasehold in the fourth quarter of 2015, the offset being a charge to Exploration expense, and writing off the $1.9 million in equipment inventory to Other operating loss, net.
In October 2014, we entered into the Subsequent Exploration Phase (“SEP”), together with our working interest partner, Sonangol P&P. The SEP extends the exploration period for an additional three year period such that the new expiry date for exploration activities is November 30, 2017. The SEP requires us and our partner to acquire 3D seismic and to drill two additional exploration wells. The seismic related commitment was completed in 2013. The two-well commitment under the primary exploration period carried over to the SEP period. In the first quarter of 2015, we drilled an unsuccessful exploratory well on the Kindele prospect, a post-salt objective, meeting one of the well commitments.
A $10.0 million dollar assessment ($5.0 million dollars net to VAALCO) applied to each of the three remaining commitment exploration wells for which drilling has not commenced before November 30, 2017. Due to the current outlook for oil prices and the uncertainties about the timing for our partner to pay its share of future costs, there may be delays in drilling the remaining three wells. We have continued to classify the $15.0 million commitment for drilling these wells as long term restricted cash on our balance sheet. We believe that it is not probable that we will incur any liability related to not meeting the commitment deadline to drill the three remaining wells as stated in the production sharing agreement with the Angolan government as the government has caused multiple delays in the Company obtaining a partner to participate in the future well commitments. We will seek to extend the term of the exploration license and hence the well commitment deadline in the coming months.
Equatorial Guinea Segment
Offshore – Block P
VAALCO has a 31% working interest in a portion of Block P, offshore Equatorial Guinea, which was acquired for $10.0 million in 2012 primarily for the exploration potential on the block. Prior to our acquisition in the block, two oil discoveries had been made on the block, establishing a development and production area in the block (the “PDA”). At the time the PDA was established, the block was divided into PDA and non-PDA portions, and we do not have a participating interest in the non-PDA portion of the block. The Ministry of Mines, Industry and Energy and GEPetrol, the current block operator, are currently reviewing a revised joint operating agreement which names us as operator. Given the current depressed commodity price cycle, it is likely we will minimize any near-term expenditures and expenses in Equatorial Guinea. We and our partners are also working on timing and budgeting for development and exploration activities in the PDA, including the approval of a development and production plan. Development project economics are being re-evaluated considering the continued depressed oil prices and the expected decrease in development costs associated with the fall in oil prices. The production sharing contract covering the PDA provides for a development and production period of twenty-five years from the date of approval of a development and production plan.
United States Segment
We acquired a 640 acre lease in the Hefley field (Granite Wash formation) in North Texas in December 2010, which is held by production from two wells drilled and brought on line in 2011 and 2012. During 2015, the two wells produced approximately 3,000 Bbls of condensate and 181 MMcf net to VAALCO. Due to declines in oil and natural gas prices, we recorded an impairment charge of $3.2 million in the fourth quarter of 2015 related to the Hefley and other U.S. fields. No capital expenditures occurred in 2015, and no additional capital expenditures are anticipated in 2016 for this property.
In September 2011, we acquired a 65% working interest in approximately 22,000 gross acres (14,300 net acres) covering the Middle Bakken and deeper formations in the East Poplar unit and the Northwest Poplar field in Roosevelt County, Montana. The working interest was subsequently reduced to 50% and 11,000 net acres in December 2012. Pursuant to the terms of the acquisition, we were required to drill three wells at our sole cost, all three of which were unsuccessful. The related leases are held by production from other zones. Due to the sustained low oil prices, we determined that it is uneconomic for us to pursue exploration on these leases, and we charged the remaining unimpaired costs of $1.2 million to exploration expense in 2015.
10
DRILLING ACTIVITY
The table below reports the results of our drilling activity for each of the last three years. International encompasses the Gabon, Angola and Equatorial Guinea segments. With the exception of the Kindele exploratory dry hole drilled in Angola during 2015, all International activity was in Gabon.
|
International |
United States |
|||||||||||||||||||||||
|
Gross |
Net |
Gross |
Net |
|||||||||||||||||||||
|
2015 |
2014 |
2013 |
2015 |
2014 |
2013 |
2015 |
2014 |
2013 |
2015 |
2014 |
2013 |
|||||||||||||
|
Exploratory wells |
||||||||||||||||||||||||
|
Productive |
- |
- |
- |
- |
- |
- |
- |
- |
- |
- |
- |
- |
||||||||||||
|
Dry |
2.0 |
(1) |
1.0 | 2.0 | 1.0 | 0.4 | 0.6 |
- |
- |
2.0 |
- |
- |
1.7 | |||||||||||
|
In progress |
- |
- |
1.0 |
- |
- |
0.4 |
- |
- |
- |
- |
- |
- |
||||||||||||
|
Development wells |
||||||||||||||||||||||||
|
Productive |
6.0 |
(2) |
1.0 | 1.0 | 1.8 | 0.3 | 0.3 |
- |
- |
- |
- |
- |
- |
|||||||||||
|
Dry |
- |
- |
- |
- |
- |
- |
- |
- |
- |
- |
- |
- |
||||||||||||
|
In progress |
- |
2.0 |
- |
- |
0.6 |
- |
- |
- |
- |
- |
- |
- |
||||||||||||
|
Total wells |
8.0 | 4.0 | 4.0 | 2.8 | 1.3 | 1.3 |
- |
- |
2.0 |
- |
- |
1.7 | ||||||||||||
(1)Includes the N’Gongui No. 2 discovery well which had been suspended since being drilled onshore Gabon in 2012 and was deemed to be unsuccessful in 2015.
(2)Includes the Etame 8-H well that was in progress at December 31, 2014, evaluated for H2S in 2015 and then shut-in when the presence of H2S was confirmed.
ACREAGE AND PRODUCTIVE WELLS
Below is the total acreage under lease and the total number of productive oil and natural gas wells as of December 31, 2015:
|
International |
United States |
|||||||
|
Gross |
Net |
Gross |
Net |
|||||
|
(Acreage in thousands) |
||||||||
|
Developed acreage |
28.7 | 8.1 | 0.7 | 0.7 | ||||
|
Undeveloped acreage |
1,727.0 | 688.0 |
(1) |
21.9 | 10.7 | |||
|
Productive natural gas wells |
- |
- |
2.0 | 2.0 | ||||
|
Productive oil wells |
13.0 |
(2) |
3.9 | 1.0 | 0.0 | |||
|
(1) |
We have net undeveloped acreage of 560,000 acres in Angola, 110,000 acres onshore Gabon and 18,000 acres in Equatorial Guinea. |
|
(2) |
Includes the one Avouma/South Tchibala field well undergoing workover at December 31, 2015, but excludes the Etame 8-H and three Ebouri field wells shut-in due to the presence of H2S. |
RESERVE INFORMATION
Net Proved Reserves
In accordance with the current guidelines of the SEC, estimates of future net cash flow from our properties and the present value thereof are made using an unweighted, arithmetic average of the first-day-of-the-month price for each of the 12 months the year. Such prices are held constant throughout the life of the properties except where such guidelines permit alternate treatment, including the use of fixed and determinable contractual price escalations. For 2015, such average prices used for our reserve estimates reflected consistently low prices during the year and were $49.36 per Bbl for crude oil from Gabon, $40.43 per Bbl of U.S. crude oil and condensate and $2.35 per Mcf for U.S. natural gas. This compares to much higher average prices for 2014 of $98.88 per Bbl, $86.49 per Bbl and $5.193 per Mcf, respectively. Further declines in prices could result in the estimated quantities and present values of our reserves being reduced.
Reserves are reported by geographic area. International consists solely of net proved reserves related to the Etame Marin block located offshore Gabon in west Africa. We have no proved reserves related to our other international ventures. There have been no estimates of total proved net oil or gas reserves filed with or included in reports to any federal authority or agency other than the SEC since the beginning of the last fiscal year. Natural gas volumes as of December 31, 2015 include natural gas liquid (“NGL”) barrels which were converted to Mmcf using the relative prices of the products. NGLs represent less than 1.5% of our total proved reserves at December 31, 2015 on a barrel of oil equivalent basis. The table below sets forth our estimated net proved reserve quantities for the years ended December 31, 2015, 2014, and 2013 as prepared by Netherland, Sewell & Associates, Inc. (“NSAI”), independent petroleum engineers.
11
|
As of December 31, |
|||||||||
|
2015 |
2014 |
2013 |
|||||||
|
Crude oil |
|||||||||
|
Proved developed reserves (MBbls) |
|||||||||
|
International |
2,840 | 3,197 | 3,279 | ||||||
|
United States |
15 | 27 | 26 | ||||||
|
Total proved developed reserves (MBbls) |
2,855 | 3,224 | 3,305 | ||||||
|
Proved undeveloped reserves (MBbls) |
|||||||||
|
International |
- |
5,036 | 3,927 | ||||||
|
United States |
- |
- |
- |
||||||
|
Total proved undeveloped reserves (MBbls) |
- |
5,036 | 3,927 | ||||||
|
Total proved reserves (MBbls) |
|||||||||
|
International |
2,840 | 8,233 | 7,206 | ||||||
|
United States |
15 | 27 | 26 | ||||||
|
Total proved reserves (MBbls) |
2,855 | 8,260 | 7,232 | ||||||
|
Natural gas |
|||||||||
|
Proved developed reserves (MMcf) |
|||||||||
|
International |
- |
- |
- |
||||||
|
United States |
1,053 | 1,406 | 1,333 | ||||||
|
Total proved developed reserves (MMcf) |
1,053 | 1,406 | 1,333 | ||||||
|
Total proved reserves (MMcf) |
|||||||||
|
International |
- |
- |
- |
||||||
|
United States |
1,053 | 1,406 | 1,333 | ||||||
|
Total proved reserves (MMcf) |
1,053 | 1,406 | 1,333 | ||||||
|
Total proved reserves (MBOE) |
3,031 | 8,494 | 7,454 | ||||||
|
Standardized measure of discounted future net cash flows (in thousands) |
$ |
27,141 |
$ |
149,387 |
$ |
137,436 | |||
Changes in Proved Reserves
The following table shows changes in total proved reserves for all presented years
|
Proved Reserves |
||||||
|
Crude Oil |
Natural Gas |
Oil Equivalent |
||||
|
(MBbls) |
(MMcf) |
(MBOE) |
||||
|
Balance at January 1, 2013 |
7,488 | 1,544 | 7,745 | |||
|
Production |
(1,549) | (325) | (1,603) | |||
|
Revisions of previous estimates |
771 | 114 | 790 | |||
|
Extensions and discoveries |
522 |
- |
522 | |||
|
Balance at December 31, 2013 |
7,232 | 1,333 | 7,454 | |||
|
Production |
(1,351) | (227) | (1,389) | |||
|
Revisions of previous estimates |
2,312 | 300 | 2,362 | |||
|
Extensions and discoveries |
67 |
- |
67 | |||
|
Balance at December 31, 2014 |
8,260 | 1,406 | 8,494 | |||
|
Production |
(1,659) | (181) | (1,688) | |||
|
Revisions of previous estimates |
(3,746) | (172) | (3,775) | |||
|
Balance at December 31, 2015 |
2,855 | 1,053 | 3,031 | |||
The information set forth in the foregoing tables includes revisions for certain reserve estimates attributable to proved properties included in the preceding year’s estimates. Such revisions are the result of additional information from subsequent completions and production history from the properties involved or the result of a decrease (or increase) in the projected economic life of such properties resulting from changes in product prices. Moreover, crude oil amounts shown for Gabon are recoverable under a service contract and the reserves in place at the end of the contract remain the property of the Gabon government.
We do not book proved reserves on discoveries until such time as a development plan has been prepared and approved by our partners in the discovery. Furthermore, if a government agreement that the reserves are commercial is required to develop the field, this approval must have been received prior to booking any reserves.
The net negative revisions of previous estimates in 2015 were primarily a result of the loss of 3.5 years of production due to lower oil and natural gas prices (2,705 MBOE) and the removal of sour reserves (1,440 MBbl), partially offset by positive revisions due to the performance of wells drilled in the 2014-2015 drilling campaign exceeding expectations (370 MBbl). The oil price used to value reserves for 2015 was $49.36 per Bbl, which is almost 50% lower than the $98.88 per Bbl used for 2014 reserves. This price decrease
12
accelerated the economic cutoff date for the Etame Marin block reserves from December 2021 as of the end of 2014 to May 2018 as of the end of 2015. Investigations into the cause of the crude souring indicate that the effect is not as widespread as previously projected and the volume of sour resources is less than earlier estimates. As discussed in “Hydrogen Sulfide Impact” above, crude sweetening options were studied extensively over the course of 2015; however, all of the options were uneconomic in the current commodity price environment.
The net positive revisions of previous estimates in 2014 were primarily due to better reservoir performance at the Avouma/South Tchibala field (1,507 MBbls) and a combination of better reservoir performance from existing wells at Etame, and revisions to proved undeveloped reserves at Etame (1,122 MBbls). The Ebouri field proved undeveloped reserves were revised downward (300 MBbls) due to higher costs of developing the reserves rendering them uneconomic. In 2014, the extensions and discoveries were associated with the booking of the Southeast Etame and North Tchibala reserves.
The net positive revisions of previous estimates in 2013 were primarily due to better reservoir performance at the Etame field (800 MBbls). Extensions and discoveries in 2013 were due to the drilling of the Avouma 3H well which extended the reservoir boundary further to the north at the Avouma field.
There are numerous uncertainties inherent in estimating quantities of proved reserves and in projecting future rates of production and timing of development expenditures, including many factors beyond our control. Reserve engineering is a subjective process of estimating underground accumulations of oil and natural gas that cannot be measured in an exact manner, and the accuracy of any reserve estimate is a function of the quality of available data and of engineering and geological interpretation and judgment. The quantities of oil and natural gas that are ultimately recovered, production and operating costs, the amount and timing of future development expenditures and future oil and natural gas sales prices may all differ from those assumed in these estimates. The standardized measure of discounted future net cash flows should not be construed as the current market value of the estimated oil and natural gas reserves attributable to our properties.
Proved Undeveloped Reserves
We annually review all proved undeveloped reserves (“PUDs”) to ensure an appropriate plan for development exists. Continued declines in oil and natural gas prices in 2015 have caused our PUDs to become uneconomic to develop at the prices required by the SEC guidelines. Accordingly, we have no PUDs at December 31, 2015 compared with 5,036 MBbls of PUDs December 31, 2014. Reserves related to the successful wells drilled in 2015 were transferred to proved developed producing reserves during the year. The remaining PUD reserves were reclassified to unproved due to lower oil prices.
Controls over Reserve Estimates
Our policies and practices regarding internal controls over the recording of reserves is structured to objectively and accurately estimate our oil and natural gas reserves quantities and present values in compliance with Securities Exchange Commission (“SEC”) regulations and generally accepted accounting principles in the U.S. (“GAAP”). Compliance with these rules and regulations with respect to our reserves is the responsibility of a reservoir engineer, who is our principal engineer. Our principal engineer has over 20 years of experience in the oil and natural gas industry, including over 10 years as a reserve evaluator, trainer or manager and is a qualified reserves estimator, as defined by the Society of Petroleum Engineers’ standards. Further professional qualifications include a Bachelor’s and Master’s degree in petroleum engineering, extensive internal and external reserve training, and asset evaluation and management. In addition, the principal engineer is an active participant in industry reserve seminars, professional industry groups and has been a member of the Society of Petroleum Engineers for over 20 years. The Audit Committee of the Board of Directors meets periodically with management to discuss matters and policies related to reserves.
Our controls over reserve estimation include retaining NSAI as our independent petroleum and geological firm for all years presented. We provide information to NSAI about our oil and natural gas properties which includes, but is not limited to, production profiles, ownership and production sharing rights, prices, costs and future drilling plans. NSAI prepares its own estimates of the reserves attributable to our properties. All of the information regarding reserves in this Annual Report on Form 10-K is derived from the report of NSAI, a worldwide leader of petroleum property analysis for industry and financial organizations and government agencies. NSAI was founded in 1961 and performs consulting petroleum engineering services under Texas Board of Professional Engineers Registration No. F-2699. The report of NSAI is filed as an exhibit to this Annual Report on Form 10-K. Within NSAI, the technical persons primarily responsible for preparing the estimates set forth in the NSAI reserves report incorporated herein are Mr. John R. Cliver and Mr. Mike K. Norton. Mr. Cliver, a Licensed Professional Engineer in the State of Texas, has been practicing consulting petroleum engineering at NSAI since 2009 and has over 5 years of prior industry experience. He graduated from Rice University in 2004 with a Bachelor of Science Degree in Chemical Engineering and from University of Texas at Austin in 2008 with a Master of Business Administration Degree. Mr. Norton, a Licensed Professional Geoscientist in the State of Texas, has been practicing consulting petroleum geoscience at NSAI since 1989 and has over 10 years of prior industry experience. He graduated from Texas A&M University in 1978 with a Bachelor of Science Degree in Geology. Both technical principals meet or exceed the education, training, and experience requirements set forth in the Standards Pertaining to the Estimating and Auditing of Oil and Gas Reserves Information promulgated by the Society of Petroleum Engineers; both are proficient in judiciously applying industry standard practices to engineering and geoscience evaluations as well as applying SEC and other industry reserves definitions and guidelines.
13
Net Volumes sold, Prices, and Production Costs
Net volumes sold, average sales prices per unit, and production costs per unit for our 2015, 2014, and 2013 operations are shown in the tables below.
|
Year Ended December 31, |
|||||||||||||||||||||||||||
|
2015 |
2014 |
2013 |
|||||||||||||||||||||||||
|
Oil |
Oil and |
Natural |
Oil |
Oil and |
Natural |
Oil |
Oil and |
Natural |
|||||||||||||||||||
|
Equivalent |
Condensate |
Gas |
Equivalent |
Condensate |
Gas |
Equivalent |
Condensate |
Gas |
|||||||||||||||||||
|
(MBOE) |
(MBbl) |
(MMcf) |
(MBOE) |
(MBbl) |
(MMcf) |
(MBOE) |
(MBbl) |
(MMcf) |
|||||||||||||||||||
|
Net production sold |
|||||||||||||||||||||||||||
|
International |
1,679 | 1,679 |
- |
1,348 | 1,348 |
- |
1,544 | 1,544 |
- |
||||||||||||||||||
|
United States |
33 | 3 | 181 | 41 | 3 | 227 | 59 | 5 | 325 | ||||||||||||||||||
|
Total production sold |
1,712 | 1,682 | 181 | 1,389 | 1,351 | 227 | 1,603 | 1,549 | 325 | ||||||||||||||||||
|
Year Ended December 31, |
|||||||||||||||||||||||||||
|
2015 |
2014 |
2013 |
|||||||||||||||||||||||||
|
Oil |
Oil and |
Natural |
Oil |
Oil and |
Natural |
Oil |
Oil and |
Natural |
|||||||||||||||||||
|
Equivalent |
Condensate |
Gas |
Equivalent |
Condensate |
Gas |
Equivalent |
Condensate |
Gas |
|||||||||||||||||||
|
($/BOE) |
($/Bbl) |
($/Mcf) |
($/BOE) |
($/Bbl) |
($/Mcf) |
($/BOE) |
($/Bbl) |
($/Mcf) |
|||||||||||||||||||
|
Average sales price |
|||||||||||||||||||||||||||
|
International |
$ |
47.87 |
$ |
47.87 |
$ |
- |
$ |
93.68 |
$ |
93.68 |
$ |
- |
$ |
108.42 |
$ |
108.42 |
$ |
- |
|||||||||
|
United States |
15.09 | 32.67 | 2.21 | 32.40 | 85.89 | 4.57 | 31.89 | 85.24 | 4.50 | ||||||||||||||||||
|
Overall average sales price |
47.24 | 47.85 | 2.21 | 91.86 | 93.66 | 4.57 | 105.60 | 108.35 | 4.50 | ||||||||||||||||||
|
Year Ended December 31, |
|||||||||||||||||||||||||||
|
2015 |
2014 |
2013 |
|||||||||||||||||||||||||
|
Average production expense per MBOE |
|||||||||||||||||||||||||||
|
International |
$ |
23.79 |
$ |
23.01 |
$ |
23.63 | |||||||||||||||||||||
|
United States |
4.67 | 9.88 | 2.18 | ||||||||||||||||||||||||
|
Overall average production expense |
23.42 | 22.62 | 22.84 | ||||||||||||||||||||||||
AVAILABLE INFORMATION
We file annual, quarterly and current reports, proxy statements and other information with the SEC. You may read and copy any document we file at the SEC’s Public Reference Room at 100 F Street, N.E., Washington, D.C. 20549. Please call the SEC at 1-800-SEC-0330 for further information on the SEC’s Public Reference Room. Our SEC filings are also available to the public at the SEC’s website at www.sec.gov.
You may also obtain copies of our annual, quarterly and current reports, proxy statements and certain other information filed with the SEC, as well as amendments thereto, free of charge from our website at www.vaalco.com. No information from the either the SEC’s or our website is incorporated by reference herein. We have placed on our website copies of our Audit Committee Charter, Code of Business Conduct and Ethics, and Code of Ethics for the Chief Executive Officer and Chief Financial Officer. Stockholders may request a printed copy of these governance materials by writing to the Corporate Secretary, VAALCO Energy, Inc., 9800 Richmond Avenue, Suite 700, Houston, Texas 77042.
CUSTOMERS
Prior to the second quarter in 2014, we sold oil from Gabon under contracts with Mercuria Trading NV (“Mercuria”) beginning with the calendar year 2011. Beginning in the second quarter of 2014 and through April 2015, we switched to an agency model by contracting with a third party, The Vitol Group, to sell our crude oil on the spot market for a fixed per barrel fee. Beginning in May 2015, we have sold our crude oil production from Gabon under a term contract with pricing based upon an average of Dated Brent in the month of lifting, adjusted for location and market factors. The contracted purchasers were TOTSA Total Oil Trading SA (“Total”) for May through July of 2015 and Glencore Energy UK Ltd. (“Glencore”) for August through December of 2015. The contract with Glencore U.K. ends in July 2016. Sales of oil to Glencore U.K. and Total were 38% and 27% of total revenues for 2015, respectively, with less than 1% related to U.S. production.
14
EMPLOYEES
As of December 31, 2015, we had 125 full-time employees, 80 of whom were located in Gabon and seven of whom were located in Angola. We are not subject to any collective bargaining agreements, although most of the national employees in Gabon are members of the NEOP (National Organization of Petroleum Workers) union. We believe relations with employees are satisfactory.
COMPETITION
The oil and natural gas industry is highly competitive. Competition is particularly intense from other independent operators and from major oil and natural gas companies with respect to acquisitions of desirable oil and natural gas properties and contracting for drilling equipment. There is also competition for the hiring of experienced personnel. In addition, the drilling, producing, processing and marketing of oil and natural gas is affected by a number of factors beyond our control which may delay drilling, increase prices and have other adverse effects which cannot be accurately predicted.
Our competition for acquisitions, exploration, development and production includes the major oil and natural gas companies in addition to numerous independent oil companies, individual proprietors, investors and others. Many of these competitors possess financial, technical and personnel resources substantially in excess of those available to us, giving those competitors an enhanced ability to evaluate and acquire desirable leases properties or prospects. Our ability to generate reserves in the future will depend on our ability to select and acquire suitable producing properties and/or developing prospects for future drilling and exploration.
INSURANCE
We are not fully insured against all risks associated with our business either because such insurance is unavailable or because premium costs are considered uneconomic. A material loss not fully covered by insurance could have an adverse effect on our financial position, results of operations or cash flows. We maintain insurance at levels we believe to be customary in the industry to limit our financial exposure in the event of a substantial environmental claim resulting from sudden, unanticipated and accidental discharges of certain prohibited substances in to the environment. Such insurance might not cover the complete claim amount and would not cover fines or penalties for a violation of environmental law.
ENVIRONMENTAL REGULATIONS
General
Our activities are subject to federal, state and local laws and regulations governing environmental quality and pollution control in Gabon, Angola and the U.S., and will be subject to the laws and regulations of Equatorial Guinea when exploration drilling occurs in those countries. Although no assurances can be made, we believe that, absent the occurrence of an extraordinary event, compliance with existing laws, rules and regulations regulating the release of materials into the environment or otherwise relating to the protection of the environment will not have a material effect upon our capital expenditures, earnings or competitive position with respect to its existing assets and operations. We cannot predict what effect future regulation or legislation, enforcement policies, and claims for damages to property, employees, other persons and the environment resulting from our operations could have on our activities. In part because they are developing countries, it is unclear how quickly and to what extent Gabon, Angola or Equatorial Guinea will increase their regulation of environmental issues in the future; any significant increase in the regulation or enforcement of environmental issues by Gabon, Angola or Equatorial Guinea could have a material effect on us. Developing countries, in certain instances, have patterned environmental laws after those in the U.S., which are discussed below. However, the extent to which any environmental laws are enforced in developing countries varies significantly.
In the U.S., environmental laws and regulations may require the acquisition of permits before drilling commences, the installation of pollution control equipment for our operations, special handling or disposal of materials used in our operations, or remedial measures to mitigate pollution from our operations or on the properties on which we operate. These laws and regulations may also restrict the types of substances used in our drilling operations which can be used or released into the environment or limit or prohibit drilling activities on certain lands such as wetlands or sensitive protected areas or restrict the rate of production below the rate that would otherwise be possible.
As a general matter, the oil and natural gas exploration and production industry has been and continues to be the subject of increasing scrutiny and regulation by environmental authorities. The Environmental Protection Agency (“EPA”) has identified environmental compliance by the energy extraction sector as one of its enforcement initiatives for 2014-2016 (and has solicited comments on continuing this initiative for fiscal years 2017-2019). The trend has been the enactment of new or more stringent requirements on the oil and natural gas industry. These changes result in increased operating costs, and additional changes could results in further increases in our costs for environmental compliance.
Environmental Regulations in the United States
Superfund
We currently own or lease, and in the past we have owned or leased, properties that have been used for the exploration and production of oil and natural gas for many years. Although we have used operating and disposal practices that were standard in the industry at the time, hydrocarbons or other wastes may have been disposed or released on or under the properties owned or leased by us or on or under
15
locations where such wastes have been taken for disposal. In addition, some of these properties are or have been operated by third parties. We have no control over such entities’ treatment of hydrocarbons or other solid wastes and the manner in which such substances may have been disposed or released. State and federal laws applicable to oil and natural gas wastes and properties have gradually become stricter over time. We could, in the future, be required to remediate property, including groundwater, containing or impacted by previously disposed wastes (including wastes disposed or released by prior owners or operators, or property contamination, including groundwater contamination by prior owners or operators) or to perform remedial plugging operations to prevent future contamination or mitigate existing contamination.
The federal Comprehensive Environmental Response, Compensation and Liability Act (“CERCLA”), also known as the “Superfund” law, generally imposes joint and several liability for costs of investigation and remediation and for natural resource damages, without regard to fault or the legality of the original conduct, on certain classes of persons with respect to the release into the environment of substances designated under CERCLA as hazardous substances (“Hazardous Substances”). These classes of persons, or so-called potentially responsible parties (“PRPs”), include the current and certain past owners and operators of a facility where there has been a release or threat of release of a Hazardous Substance and persons who disposed of or arranged for the disposal of Hazardous Substances found at a facility. CERCLA also authorizes the EPA and, in some cases, third parties to take actions in response to threats to the public health or the environment and to seek to recover from the PRPs the costs of such action.
Although CERCLA generally exempts “petroleum” from the definition of a Hazardous Substance, in the course of its operations, we have generated and will generate substances that may fall within CERCLA’s definition of a Hazardous Substance and may have disposed of these substances at disposal sites owned and operated by others. We may also be the owner or operator of sites on which Hazardous Substances have been released. To its knowledge, neither VAALCO nor its predecessors have been designated as a PRP by the EPA under CERCLA; we also do not know of any prior owners or operators of its properties that are named as PRPs related to their ownership or operation of such properties. States such as Texas have comparable statutes which may cover substances (including petroleum) in addition to those covered under CERCLA. In the event contamination is discovered at a site on which we are or has been an owner or operator or to which we sent regulated substances, we could be liable for costs of investigation and remediation and damages to natural resources.
Solid and Hazardous Waste Handling
We generate wastes, including hazardous wastes that are subject to the federal Resource Conservation and Recovery Act (“RCRA”) and comparable state statutes. The EPA and various state agencies have limited the disposal options for certain wastes, including wastes designated as hazardous under RCRA and comparable state statutes (“Hazardous Wastes”). Furthermore, although most oil and natural gas wastes generally are exempt from regulation as hazardous waste, not all current comparable state statutes may provide this exemption, and certain wastes generated may be subject to RCRA or comparable state statutes. It is possible that certain wastes generated by our oil and natural gas operations that are currently exempt may in the future be designated as Hazardous Wastes under RCRA or other applicable statutes and, therefore, may be subject to more rigorous and costly operating and disposal requirements.
Clean Water Act
The Clean Water Act (“CWA”) and analogous state laws impose restrictions and strict controls regarding the discharge (including spills and leaks) of pollutants, including produced waters and other oil and natural gas wastes, into state waters and waters of the U.S., a term broadly defined. These controls have become more stringent over the years, and it is probable that additional restrictions will be imposed in the future. Generally, permits must be obtained to discharge pollutants. The CWA provides for civil, criminal and administrative penalties for unauthorized discharges of oil and hazardous substances and of other pollutants. It imposes substantial potential liability for the costs of removal or remediation associated with discharges of oil or other pollutants. The CWA also prohibits the discharge of fill materials to regulated waters, including wetlands, without a permit. State laws governing discharges to water also provide varying civil, criminal and administrative penalties and impose liabilities in the case of a discharge of petroleum or its derivatives, or other pollutants, into state waters. In addition, the EPA has promulgated regulations that may require us to obtain permits to discharge storm water runoff, including discharges associated with construction activities. In the event of an unauthorized discharge of wastes, we may be liable for penalties as well as cleanup and response costs.
Oil Pollution Act
The Oil Pollution Act of 1990 (“OPA”), which amends and augments the oil spill provisions of the CWA, imposes certain duties and liabilities on certain “responsible parties” related to the prevention of oil spills and damages resulting from such spills in or threatening U.S. waters or adjoining shorelines. A liable “responsible party” includes the owner or operator of a facility, vessel or pipeline that is a source of an oil discharge or that poses the substantial threat of discharge, or in the case of offshore facilities, the lessee or permittee of the area in which a discharging facility is located. OPA assigns joint and several liability, without regard to fault, to each liable party for oil removal costs and a variety of public and private damages. Although defenses exist to the liability imposed by OPA, they are limited. In the event of an oil discharge or substantial threat of discharge, we may be liable for costs and damages.
16
The OPA also imposes ongoing requirements on a responsible party, including proof of financial responsibility to cover at least some costs in a potential spill. Certain amendments to the OPA that were enacted in 1996 require owners and operators of offshore facilities that have a worst case oil spill potential of more than 1,000 Bbls to demonstrate financial responsibility in amounts ranging from $10.0 million in specified state waters and $35.0 million in federal outer continental shelf (“OCS”) waters, with higher amounts, up to $150.0 million based upon worst case oil-spill discharge volume calculations. In light of recent events, it is possible that these requirements may become more stringent. We believe that currently we have established adequate proof of financial responsibility for our offshore facilities.
Hydraulic Fracturing
Hydraulic fracturing involves the injection of water, sand (or other proppant) and chemicals under pressure into formations to fracture the surrounding rock and stimulate production. Hydraulic fracturing activities are typically regulated by state oil and natural gas commissions but not as extensively at the federal level. For example, the federal Safe Drinking Water Act (“SDWA”) protects underground sources of drinking water through the EPA’s underground injection control (“UIC”) program, which regulates the subsurface emplacement of fluid. The definition of “underground injection” in the SDWA expressly excludes the “underground injection of fluids or propping agents (other than diesel fuel) pursuant to hydraulic fracturing operations.” Due to public concerns raised regarding potential impacts of hydraulic fracturing on groundwater quality, there have been recent developments at the federal and state levels that could result in regulation of hydraulic fracturing becoming more stringent and costly.
In February 2014, the EPA issued guidance regarding federal regulatory authority under the SDWA over hydraulic fracturing using diesel fuel, specifying that owners or operators of wells who inject diesel fuels for hydraulic fracturing related to oil and natural gas operations must obtain a permit under the Class II well category under the EPA’s UIC program regulations before injection begins. This guidance also identified fluids associated with five Chemical Abstracts Services (“CAS”) registry numbers as the most appropriate interpretation of the statutory term “diesel fuels” to use for permitting hydraulic fracturing that uses diesel fuels under the EPA’s UIC program. This guidance also clarified that diesel fuels used as a component of drilling muds or pipe joint compounds used in the well construction process or in motorized equipment at the surface are not subject to UIC Class II permitting requirements because such uses of diesel fuels are considered to be part of the well construction process and not diesel fuels injected for purposes of hydraulic fracturing.
The EPA also commenced a study of the potential environmental impacts of hydraulic fracturing in 2012 and released a draft of the study in 2015. This study and EPA’s enforcement initiative for the energy extraction sector could result in additional regulatory requirements that could make it difficult to perform hydraulic fracturing and increase our costs of compliance and doing business.
In addition, a committee of the U.S. House of Representatives conducted an investigation of hydraulic fracturing practices. Moreover, in past sessions legislation was introduced before Congress to provide for federal regulation of hydraulic fracturing by eliminating the current exemption in the Safe Drinking Water Act, and, further, to require disclosure of the chemicals used in the fracturing process. Also, some states have adopted, and other states are considering adopting, regulations that restrict hydraulic fracturing in certain circumstances or that require disclosure of the chemicals in the fracturing fluids. Additionally some states, localities and river basin conservancy districts have exercised or considered exercising their regulatory powers to limit, and in some cases place a moratorium on hydraulic fracturing.
The Bureau of Land Management (“BLM”) has regulated hydraulic fracturing activities on federal lands since 1983, but the BLM’s historic regulations were not written to address modern hydraulic fracturing activities. The BLM has finalized revisions to its hydraulic fracturing regulations. Among other things, the BLM rules impose new requirements to validate the protection of groundwater, disclosure of chemicals used in hydraulic fracturing and higher standards for the interim storage of recovered waste fluids from hydraulic fracturing. This rule is the subject of legal challenges and a federal district court in Wyoming has issued a preliminary injunction temporarily delaying implementation of the BLM rules.
Further, in response to a petition filed in January 2012 under section 21 of the Toxic Substances Control Act (“TSCA”), the EPA issued an Advance Notice of Proposed Rulemaking, RIN 2070-AJ93 (“ANPR”), which was published in the Federal Register on May 19, 2014. The EPA indicated that the purpose of this ANPR is soliciting public comment on the information that should be reported or disclosed for hydraulic fracturing chemical substances and mixtures and the mechanism for obtaining this information, minimizing reporting burdens and avoiding duplication of state and other federal agency information collections, and soliciting comments on incentives and recognition programs that “could be used to support the development and use of safer chemicals in hydraulic fracturing”. The public comment period for this ANPR was extended for an additional month and ended on September 18, 2014. The next phase of this regulatory rulemaking process is still pending at the EPA. Further, in 2015, the EPA proposed wastewater pretreatment standards for discharges of wastewater pollutants from onshore unconventional oil and natural gas extraction facilities to publicly-owned treatment works.
If new laws or regulations imposing significant restrictions or conditions on hydraulic fracturing activities are adopted in areas where we conduct business, we could incur substantial compliance costs and such requirements could adversely delay or restrict our ability to conduct fracturing activities on our U.S. assets.
National Environmental Policy Act
Oil and natural gas exploration and production activities on federal lands may be subject to the National Environmental Policy Act, or NEPA, which requires federal agencies, including the Department of Interior, to evaluate major agency actions having the potential to significantly impact the environment. In the course of such evaluations, an agency will prepare an Environmental Assessment that
17
assesses the potential direct, indirect and cumulative impacts of a proposed project and, if necessary, will prepare a more detailed Environmental Impact Statement that may be made available for public review and comment. To the extent that our current exploration and production activities, as well as proposed exploration and development plans, on federal lands require governmental permits that are subject to the requirements of NEPA, this process has the potential to delay or impose additional conditions upon the development of oil and natural gas projects.
Endangered Species Act
The Endangered Species Act (“ESA”) was established to protect endangered and threatened species. Pursuant to that act, if a species is listed as threatened or endangered, restrictions may be imposed on activities adversely affecting that species’ habitat. Similar protections are offered to migratory birds under the Migratory Bird Treaty Act. The U.S. Fish and Wildlife Service must also designate the species’ critical habitat and suitable habitat as part of the effort to ensure survival of the species. A critical habitat or suitable habitat designation could result in further material restrictions to land use and may materially delay or prohibit land access for oil and natural gas development. If we were to have a portion of our leases designated as critical or suitable habitat, it may adversely impact the value of the affected leases.
Climate Change Legislation
More stringent laws and regulations relating to climate change and greenhouse gases (“GHGs”) may be adopted in the future and could cause us to incur material expenses in complying with them. In the absence of comprehensive federal legislation on GHG emission control, the EPA attempted to require the permitting of GHG emissions; although the Supreme Court struck down the permitting requirements, it upheld the EPA’s authority to control GHG emissions when a permit is required due to emissions of other pollutants. In addition, both houses of the U.S. Congress have considered legislation to reduce emissions of greenhouse gases without any ultimate resolution and many states have taken or considered legal measures to reduce GHG emissions, including, in a few locations, the consideration of a cap and trade program. Most cap and trade programs work by requiring major sources of emissions or major producers of fuels to acquire and surrender emission allowances. Depending on the regulatory reach of the EPA’s rules or new Clean Air Act (“CAA”) legislation or implementing regulations restricting the emission of GHGs or state programs, we could incur significant costs to control our emissions and comply with regulatory requirements. In addition, the EPA adopted a mandatory GHG emissions reporting program which imposes reporting and monitoring requirements on various industries including onshore and offshore oil and natural gas production facilities and onshore oil and natural gas processing, transmission, storage and distribution facilities. We will incur costs to monitor, keep records of, and report emissions of GHGs. We do not believe that our compliance with applicable monitoring, recordkeeping and reporting requirements under the reporting rule will have a material adverse effect on our results of operations or financial position.
Because of the lack of any comprehensive legislative program addressing GHGs, there is a great deal of uncertainty as to how federal and state regulation of GHGs will unfold and how it may impact our industry. Moreover, the federal, regional, state and local regulatory initiatives could adversely affect the marketability of the oil and natural gas that we produce. The impact of such future programs cannot be predicted, but we do not expect our operations to be affected any differently than other similarly situated domestic competitors.
In 2015, the EPA proposed new rules limiting methane emissions from the oil and natural gas industry. The proposed rules, if adopted, would amend the air emissions rules for oil and natural gas production sources and natural gas processing and transmission sources to include new standards for methane. In January 2016, BLM has proposed rules governing flaring and venting on public and tribal lands, which could require additional equipment and emissions controls as well as inspection requirements. Simultaneously with the proposal of the methane rules, the EPA released a proposal soliciting comments on two alternatives for aggregating multiple surface sites into a single-source of air quality permitting purposes. Depending upon the alternative selected by the EPA, sites which currently would not require permitting under the Clean Air Act could require permits, an outcome that could result in costs and delays to our operations; however, given the present uncertainty regarding this rule, the extent and magnitude of that impact cannot be reliably or accurately estimated.
Air Emissions
Our operations are subject to local, state and federal regulations for the control of emissions from sources of air pollution. At the federal level, the CAA is the primary statute governing air pollution. Federal and state laws require new and modified sources of air pollutants to obtain permits prior to commencing construction. Major sources of air pollutants are subject to more stringent, federally imposed requirements including additional permits. Federal and state laws designed to control hazardous (or toxic) air pollutants might require installation of additional controls. Administrative enforcement actions for failure to comply with air pollution regulations or permits are generally resolved by payment of monetary fines and correction of any identified deficiencies. Alternatively, regulatory agencies could bring lawsuits for civil penalties or require us to forego construction, modification or operation of certain air emission sources.
On April 17, 2012, the EPA issued final rules to subject oil and natural gas operations to regulation under the NSPS and National Emission Standards for Hazardous Air Pollutants (“NESHAPS”) programs under the CAA, and to impose new and amended requirements under both programs. The EPA rules provide “New Source Performance Standards” (“NSPS”) for completions of hydraulically fractured natural gas wells. These standards are applicable to new hydraulically fractured wells and also to existing wells that are refractured.
18
For each well completion operation with hydraulic fracturing begun prior to January 1, 2015, these standards require owners/operators to reduce volatile organic compound (“VOC”) emissions from natural gas not sent to the gathering line during well completion by flaring using a completion combustion device, with the option to capture the natural gas emissions using reduced emission completions (“REC” aka “green completions”). For each well completion with hydraulic fracturing begun on or after January 1, 2015, operators must capture the natural gas and make it available for use or sale, which can be done through the use of green completions.
Further, these regulations also establish specific new requirements, effective in 2012, for emissions from compressors, controllers, dehydrators, storage vessels, natural gas processing plants and certain other equipment. These rules may require changes to our operations, including the installation of new equipment to control emissions. We are currently evaluating the effect these rules will have on our business, which consists of two operated producing wells in North Texas. We have no plans at this time to pursue more U.S. properties.
OSHA and Other Regulations
To the extent not preempted by other applicable laws, we are subject to the requirements of the federal Occupational Safety and Health Act (“OSHA”) and comparable state statutes, where applicable. The OSHA hazard communication standard, the EPA community right-to-know regulations under Title III of CERCLA and similar state statutes, where applicable, require us to organize, maintain and/or disclose information about hazardous materials used or produced in our operations.
You should carefully consider the following risk factors in addition to the other information included in this report. If any of these risks or uncertainties actually occurs, our business, financial condition and results of operations could be materially adversely affected. Additional risks not presently known to us or which we consider immaterial based on information currently available to us may also materially adversely affect us.
Due to our substantial liquidity concerns, we may be unable to continue as a going concern.
Our annual revenues from oil and natural gas sales decreased from $127.7 million for 2014 to $80.4 million for 2015. Our total cash and cash equivalents at December 31, 2015 were $25.4 million, decreasing from $69.1 million as of December 31, 2014. As of December 31, 2015, we had a working capital deficit of $3.0 million. If oil and natural gas prices continue to remain at current depressed levels, we expect that for 2016 we will not generate adequate revenue to cover our operating expenses, we will generate losses from operations, and our cash flows will not be sufficient to cover our operating expenses. We currently require additional capital to execute our business plan and continue as a going concern. If we are unable to obtain capital funding, our business operations will be harmed, and we may not be able to continue as a going concern.
The operation of the terms of our existing revolving credit loan agreement may also adversely impact our liquidity. As of December 31, 2015 (and as of March 16, 2016), we had outstanding borrowings of $15.0 million under our revolving credit facility. In March 2016, we announced that the borrowing base under our revolving credit facility had been reduced to $20.1 million at December 31, 2015. The International Finance Corporation (“IFC”), our lender under the revolving credit facility, has communicated to us that if we were to seek additional drawdowns before the next scheduled redetermination date as of June 30, 2016, the IFC could elect, under the terms of the loan agreement, to conduct an interim redetermination which it believes would result in a borrowing base of less than $20.1 million if commodity prices are lower than they were at December 31, 2015. Therefore, we currently have very limited, if any, borrowing capacity under our revolving credit facility. A continuation of prevailing low price levels for oil and natural gas may cause the IFC to make further reductions in the borrowing base under the credit facility.
If we fail to satisfy our obligations with respect to our indebtedness or trade payables, or fail to comply with the financial and other restrictive covenants contained in the loan agreement governing our revolving credit facility, an event of default could result, which would permit acceleration of such debt and which could result in an event of default under the facility and acceleration of other indebtedness, and could permit our secured lender to foreclose on any of our assets securing that debt. Any accelerated debt would become immediately due and payable.
Our current financial condition and the short-term outlook for our business operations raise substantial doubt about our ability to continue as a going concern.
Our financial statements have been prepared assuming that we will continue to operate as a going concern, which contemplates the realization of assets and the satisfaction of liabilities in the normal course of business.
Our ability to borrow funds and to obtain additional capital on reasonable terms is substantially dependent on oil and natural gas prices. The prices of oil and natural gas declined dramatically in the second half of 2014 and remained low, decreasing further in 2015. Average prices for our crude oil sales have fallen from $103.23 per barrel in June 2014 to $33.56 per barrel in December 2015. As a result, our revenues decreased from $127.7 million for the year ended December 31, 2014 to $80.4 million for the year ended December 31, 2015.
Continued depressed oil and natural gas prices or further declines in oil and natural gas prices for 2016 and thereafter would have a material adverse effect on our liquidity, financial condition, results of operations and on the carrying value of our proved reserves.
We currently require additional capital to execute our business plan and continue as a going concern. If we are unable to obtain funding, our business operations will be harmed, and we may not be able to continue as a going concern.
19
We will require additional capital to continue to operate our business, expand our exploration and development programs, and continue as a going concern. Any future acquisitions and future exploration, development, production, leasing activities and marketing activities, as well as our administrative requirements, will require a substantial amount of additional capital and cash flow. We may pursue additional capital through various financial transactions or arrangements, and are considering multiple alternatives, including, but not limited to, additional debt or equity financing, a sale or farm-downs of assets, joint ventures, rescheduling discretionary portions of our capital spending to future periods or operating cost reductions. There can be no guarantee of future capital acquisition or fundraising success. Additionally, our current financial position, our current lack of cash resources and our potential inability to continue as a going concern could materially adversely affect our common share prices and our ability to obtain additional financing or new capital from sales of our capital stock.
Oil and natural gas prices are highly volatile, and continued depressed prices will negatively affect our financial results.
Our revenues, cash flow, profitability, oil and natural gas reserves value and future rate of growth are substantially dependent upon prevailing prices for oil and natural gas. Our ability to borrow funds and to obtain additional capital on reasonable terms is also substantially dependent on oil and natural gas prices. Historically, world-wide oil and natural gas prices and markets have been volatile, and may continue to be volatile in the future. In particular, the prices of oil and natural gas declined dramatically in the second half of 2014 and decreased further in 2015. During 2014, based on New York Mercantile Exchange (“NYMEX”) pricing, the spot price per Bbl of West Texas Intermediate crude oil ranged from a high of $107.26 to a low of $53.45, and the Henry Hub spot price per Mcf of natural gas ranged from a high of $6.00 to a low of $3.48. During 2015, the spot price per Bbl of West Texas Intermediate crude oil ranged from a high of $61.36 to a low of $34.55, and the Henry Hub spot price per Mcf of natural gas ranged from a high of $2.99 to a low of $1.93.
As a result of the substantial decline in oil and natural gas prices, our revenues, operating income, cash flows and borrowing capacity have been materially and adversely affected and have required reductions in the carrying value of our oil and natural gas properties and our planned level of capital expenditures. The average price at which we sold oil in 2015 was $47.85 per Bbl compared to $93.66 per Bbl in 2014, and $108.35 per Bbl in 2013. Because the oil price we are required to use by the SEC to estimate our future net cash flows is the average price over the 12 months prior to the date of determination of future net cash flows, the full effect of falling prices may not be reflected in our estimated net cash flows for several quarters. We review the carrying value of our properties on a quarterly basis and once incurred, a write-down in the carrying value of our properties is not reversible at a later date, even if oil and natural gas prices increase.
Prices for oil and natural gas are subject to wide fluctuations in response to relatively minor changes in the supply of and demand for oil and natural gas, market uncertainty and a variety of additional factors that are beyond our control. These factors include, but are not limited to, increases in supplies from U.S. shale production, international political conditions, including uprisings and political unrest in the Middle East and Africa, the domestic and foreign supply of oil and natural gas, the level of consumer demand due to slowing economic growth in China and continued weak economic growth in Europe, weather conditions, domestic and foreign governmental regulations and taxes, the price and availability of alternative fuels, the health of international economic and credit markets, the ability of the members of the Organization of Petroleum Exporting Countries (“OPEC”) and other state-controlled oil companies to agree upon and maintain oil price and production controls, and general economic conditions. In addition, various factors, including the effect of federal, state and foreign regulation of production and transportation, general economic conditions, changes in supply due to drilling by other producers and changes in demand may adversely affect our ability to market our oil and natural gas production.
Further reductions in our borrowing base under our revolving credit facility as a result of periodic borrowing base redeterminations or otherwise may negatively impact our ability to fund our operations, and we may not have sufficient funds to repay borrowings under our revolving credit facility if required as a result of a borrowing base redetermination.
As of December 31, 2015 (and at March 16, 2016), we had outstanding borrowings of $15.0 million under our revolving credit facility. Availability under our revolving credit facility is subject to a borrowing base which is subject to scheduled semiannual and other elective collateral borrowing base redeterminations based on the value of our oil and natural gas reserves as determined by the IFC, the lender under the credit facility, and other factors deemed relevant by it. We announced in March 2016 that our borrowing base had been redetermined by the IFC and reduced from $65.0 million to $20.1 million effective December 31, 2015. This reduction was primarily a result of the lower anticipated oil and natural gas prices used to determine our commitment amount. Continued low or declining prices for oil and natural gas may cause the IFC to reduce further the borrowing base under our revolving credit facility.
The IFC has also communicated to us that if we were to seek additional drawdowns under the credit facility before the next scheduled borrowing base redetermination date (as of June 30, 2016), it could elect, under the terms of the loan agreement, to conduct an interim redetermination which it believes would result in a borrowing base of less than $20.1 million, if prevailing commodity prices are lower than they were at December 31, 2015.
Any further reductions in our borrowing base as a result of borrowing base redeterminations, or otherwise, would likely negatively impact our liquidity and our ability to fund our operations and, as a result, would likely have a material adverse effect on our financial position, results of operation and cash flow. Further if, the outstanding borrowings under our revolving credit facility were to exceed the borrowing base as a result of any such redetermination, we would be required to repay the excess. We may not have sufficient funds to make such repayments. If we do not have sufficient funds and we are otherwise unable to negotiate renewals of our borrowings or arrange new financing, we may have to sell significant assets. Any such sale could have a material adverse effect on our business and results of operations.
20
For additional information regarding our revolving credit facility and our long-term indebtedness, see Item 7. “Management’s Discussion and Analysis of Financial Condition and Results of Operations —Capital Resources and Liquidity” and Note 7 to the consolidated financial statements.
Our revolving credit facility loan agreement imposes significant restrictions on our current and future operations. If we default under the loan agreement, the lender may act to accelerate our indebtedness, which would impact our ability to conduct our business and results of operations.
Our credit agreement contains a number of restrictive covenants that impose significant operating and financial restrictions on us, which may limit our ability to engage in acts that may be in our best interests. These covenants including restrictions on our ability to:
|
· |
incur additional indebtedness, guarantee debt or enter into any arrangement to assume or become obligated for financial or other obligations of another (except pursuant to a joint operating agreement); |
|
· |
pay dividends on or make other distributions in respect of, or purchase or redeem, shares of our capital stock; |
|
· |
prepay, redeem or repurchase certain debt; |
|
· |
make loans, investments and other restricted payments; |
|
· |
sell, transfer or otherwise dispose of assets; |
|
· |
create or incur liens; |
|
· |
sell, transfer or lease all or a substantial part of our assets (other than inventory or depleted or obsolete assets in the ordinary course of business); |
|
· |
enter into non-arm’s-length transactions; |
|
· |
incur or commit to make certain expenditures for fixed or other non-current assets; |
|
· |
enter into lease agreements or arrangements, other than the FPSO contract and leases necessary to carry on our business; |
|
· |
form any subsidiary; |
|
· |
terminate, amend or grant consents or waivers with respect to certain material contracts. |
|
· |
use the proceeds of loans other than as permitted by the credit agreement; |
|
· |
reduce certain of our working interests; |
|
· |
modify our organizational documents; |
|
· |
alter the business we conduct; |
|
· |
undertake or permit any merger, spin-off, consolidation or reorganization; and |
|
· |
enter into any derivative transaction without prior approval. |
In addition, the loan agreement includes certain financial ratios, including;
|
· |
a debt service coverage ratio of (i) net cash flows, plus the balance in an operating account) to (ii) debt service obligations, of at least 1.2:1 on the first day of the determination period; |
|
· |
loan-life coverage ratios with respect to (i) the present values of (a) projected net cash flow, plus (b) certain projected capital expenditures, to (ii) the aggregate amounts of the loans outstanding under the revolving credit facility in the determination period; |
|
· |
field-life coverage ratios with respect to (i) projected net cash flow up to a field-life end date for our reserves, to (ii) the aggregate amounts of the loans outstanding in the determination period; and |
|
· |
a ratio of (i) net debt as of the end of a fiscal quarter to (ii) earnings before interest, tax, depreciation and amortization, and exploration expenses (EBITDAX) for the trailing 12 months ended on the most recent quarter end, at less than 3.0:1. |
As of December 31, 2015, we were in compliance with all of our financial covenants under our revolving credit facility. However, we can make no assurance that we will be able to continue to comply with these financial covenants in the future. Failure to maintain these covenants or otherwise negotiate amendments to the credit facility could preclude us from borrowing under our credit facility and require us to immediately pay down any outstanding drawn amounts under the credit facility.
These covenants have the effect of restricting our ability to engage in certain actions, including potentially limiting our ability to sell assets, make future borrowings under the revolving credit facility or incur other additional indebtedness. Our ability to meet our net debt to EBITDAX ratio and our different coverage ratio requirements can be affected by events beyond our control, including changes in commodity prices. There can be no assurance that we will be able to comply with these covenants in future periods. In addition, if we receive any additional waivers or amendments to our revolving credit facility loan agreement, the lender may impose additional operating and financial restrictions on us.
A breach of the covenants under our revolving credit facility loan agreement could result in an event of default under the agreement. Such a default may allow the lender to accelerate payment of the indebtedness under the facility. Furthermore, if we were unable to repay the amounts due and payable under the credit facility, the lender could proceed against the collateral granted to it to secure that indebtedness.
Almost all of the value of our production and reserves is concentrated in a single block offshore Gabon, and any production problems or reductions in reserve estimates related to this property would adversely impact our business.
The Etame Marin block consists of five fields with 12 producing wells. Production from these fields constituted approximately 98% of our total production for the year ended December 31, 2015. In addition, at December 31, 2015, 93% of our total net proved reserves were
21
attributable to these fields. If mechanical problems, storms or other events curtailed a substantial portion of this production, or if the actual reserves associated with this producing property are less than our estimated reserves, our results of operations, financial condition, and cash flows could be materially adversely affected.
Increases in oil supplies from U.S. shale production, coupled with slower economic growth in economies around the world and a decision by OPEC not to cut production to support higher oil prices, has led to a dramatic reduction in oil prices. While this fall in oil prices may escalate global economic growth rates, thereby increasing demand for oil supplies, the decline in oil prices may adversely affect our results of operations.
The increase in world oil supplies being produced, due to increased U.S. shale production and OPEC’s decision not to reduce production to support higher oil prices, occurring at the same time as reduced economic activity associated with slower economic growth in China, Europe and other global economies has reduced the demand for, and the prices we receive for, our oil and natural gas production. In addition, the U.S. federal government has recently ended its decades-old prohibition of exports of crude oil produced in the lower 48 states of the U.S. It is too recent an event to determine the impact this regulatory change may have on our operations or our sales of crude oil. A sustained reduction in the prices we receive for our oil and natural gas production will have a material adverse effect on our results of operations and the borrowing base under our credit facility.
If oil and natural gas prices remain depressed for extended periods of time, we may be required to take further write-downs in the value of our oil and natural gas properties.
The estimated future net revenues attributable to our net proved reserves are prepared in accordance with current SEC guidelines, and are not intended to reflect the fair market value of our reserves. In accordance with the rules of the SEC, our reserve estimates are prepared using the un-weighted average price received for oil and natural gas based on closing prices on the first day of each month for the preceding twelve months from the date of the report. In the fourth quarter of 2014, we recorded an impairment loss of $98.3 million to write down our investment in certain fields comprising the Etame Marin block to fair value as a result of the declines in the forecasted oil prices used in the impairment testing and calculation. As a result of further declines in prices and increased development well costs, during 2015, we recorded additional impairments totaling $81.3 million related to the Etame Marin block and to various fields in the U.S. Sustained lower prices will cause the estimated quantities and present values of our reserves to be reduced, which may necessitate further write-downs.
Unless we are able to replace reserves which we have produced, our cash flows and production will decrease over time.
Our future success depends upon our ability to find, develop or acquire additional oil and natural gas reserves that are economically recoverable. Except to the extent that we conduct successful exploration or development activities or acquire properties containing proved reserves, our estimated net proved reserves will generally decline as reserves are produced. There can be no assurance that our planned development and exploration projects and acquisition activities will result in significant additional reserves or that we will have continuing success drilling productive wells at economic finding costs. The drilling of oil and natural gas wells involves a high degree of risk, especially the risk of dry holes or of wells that are not sufficiently productive to provide an economic return on the capital expended to drill the wells. In addition, our drilling operations may be curtailed, delayed or canceled as a result of numerous factors, including material changes in oil or natural gas prices, title problems, weather conditions, political instability, availability of capital, economic/currency imbalances, compliance with governmental requirements, receipt of additional seismic data or the reprocessing of existing data, prolonged periods of historically low oil and natural gas prices, failure of wells drilled in similar formations or delays in the delivery of equipment and availability of drilling rigs. Certain domestic oil and natural gas producing properties, as well as our Equatorial Guinea property are operated by third parties and, as a result, we have limited control over the nature and timing of exploration and development of such properties or the manner in which operations are conducted on such properties.
Substantial capital, which may not be available to us in the future, is required to replace and grow reserves.
To replace and grow reserves, we must make substantial capital expenditures for the acquisition, exploitation, development, exploration and production of oil and natural gas reserves. Historically, we have financed these expenditures primarily with cash flow from operations, debt, asset sales, and private sales of equity. During 2015, we participated in exploration and development projects on our international properties. In Gabon and Angola, we are the operator of the blocks and are thus responsible for contracting on behalf of all the remaining parties participating in the project. We rely on the timely payment of cash calls by our partners to pay for 69.95% of the offshore Gabon budget and 50% of the offshore Angola budget. The continued economic health of our partners could be adversely affected by low oil prices thereby adversely affecting their ability to make timely payment of cash calls. In Angola, our partner, Sonangol P&P failed to pay its cash calls timely, and was in default from the first quarter of 2015 through March 2016.
However, if continuing depressed oil and natural gas prices, operating difficulties or declines in reserves result in our revenues being less than expected or limit our ability to borrow funds, or our partners fail to pay their share of project costs, we may have a limited ability to expend the capital necessary to undertake or complete future drilling programs. We cannot assure you that the financing under our revolving credit facility will be available in the future or that additional debt or equity financing or cash generated by operations will be available to meet these requirements.
22
Our drilling activities require us to risk significant amounts of capital that may not be recovered.
Drilling activities are subject to many risks, including the risk that no commercially productive reservoirs will be encountered. There can be no assurance that new wells drilled by us will be productive or that we will recover all or any portion of our investment. Drilling for oil and natural gas may involve unprofitable efforts, not only from dry wells, but also from wells that are productive but do not produce sufficient net revenues to return a profit after drilling, operating and other costs. The cost of drilling, completing and operating wells is often uncertain and cost overruns are common. Our drilling operations may be curtailed, delayed or canceled as a result of numerous factors, many of which are beyond our control, including title problems, weather conditions, equipment failures or accidents, elevated pressure or irregularities in geologic formations, compliance with governmental requirements and shortages or delays in the delivery of equipment and services.
We have less control over our foreign investments than domestic investments, and added risk in foreign countries may affect our foreign investments.
Our international assets and operations are subject to various political, economic and other uncertainties, including, among other things, the risks of war, expropriation, nationalization, renegotiation or nullification of existing contracts, taxation policies, foreign exchange restrictions, changing political conditions, international monetary fluctuations, currency controls and foreign governmental regulations that favor or require the awarding of drilling contracts to local contractors or require foreign contractors to employ citizens of, or purchase supplies from, a particular jurisdiction. For example, the Gabonese government has recently audited the accounts of a number of energy companies, including ours, that has led to disputes. The Gabonese government has formed a new oil company that may seek to participate in oil and natural gas projects in a manner that could be dilutive to the interest of current license holders and the Gabonese government is under pressure from the Gabonese labor union to require companies to hire higher percentage of Gabonese citizens. In addition, if a dispute arises with our foreign operations, we may be subject to the exclusive jurisdiction of foreign courts or may not be successful in subjecting foreign persons, especially foreign oil ministries and national oil companies, to the jurisdiction of the U.S.
Private ownership of oil and natural gas reserves under oil and natural gas leases in the U.S. differs distinctly from our rights in foreign reserves where the state generally retains ownership of the minerals, and in many cases participates in, the exploration and production of hydrocarbon reserves. Accordingly, operations outside the U.S. may be materially affected by host governments through royalty payments, export taxes and regulations, surcharges, value added taxes, production bonuses and other charges. Gabon has indicated an interest in taking their oil in kind rather than us continuing to marketing on their behalf, which could cause fluctuations in the timing of and realized prices for oil sales.
Almost all of our proved reserves are related to the Etame Marin block located offshore Gabon. We have operated in Gabon since 1995 and believe we have good relations with the current Gabonese government. However, there can be no assurance that present or future administrations or governmental regulations in Gabon will not materially adversely affect our operations or cash flows.
Our operations may be adversely affected by violent acts such as from civil disturbances, terrorist acts, regime changes, cross-border violence, war, piracy, or other conflicts that may occur in regions that encompass our operations.
Violent acts resulting in loss of life, destruction of property, environmental damage and pollution occur around the world. Many incidents are driven by civil, ethnic, religious or economic strife. In addition, the number of incidents attributed to various terrorist organizations has increased significantly. We operate in regions of the world that have experienced such incidents or are in close proximity to areas where violence has occurred.
We monitor the economic and political environments of the countries in which we operate. However, we are unable to predict the occurrence of disturbances such as those noted above. In addition, we have limited ability to mitigate their impact.
Civil disturbances, terrorist acts, regime changes, war, or conflicts, or the threats thereof, could have the following results, among others:
|
· |
volatility in global crude oil prices which could negatively impact the global economy, resulting in slower economic growth rates, which could reduce demand for our products; |
|
· |
negative impact on the world crude oil supply if infrastructure or transportation are disrupted, leading to further commodity price volatility; |
|
· |
difficulty in attracting and retaining qualified personnel to work in areas with potential for conflict; |
|
· |
inability of our personnel or supplies to enter or exit the countries where we are conducting operations; |
|
· |
disruption of our operations due to evacuation of personnel; |
|
· |
inability to deliver our production due to disruption or closing of transportation routes; |
|
· |
reduced ability to export our production due to efforts of countries to conserve domestic resources; |
|
· |
damage to or destruction of our wells, production facilities, receiving terminals or other operating assets; |
|
· |
damage to or destruction of property belonging to our commodity purchasers leading to interruption of deliveries, claims of force majeure, and/or termination of commodity sales contracts, resulting in a reduction in our revenues; |
|
· |
inability of our service and equipment providers to deliver items necessary for us to conduct our operations resulting in a halt or delay in our planned exploration activities, delayed development of major projects, or shut-in of producing fields; |
|
· |
lack of availability of drilling rig, oilfield equipment or services if third party providers decide to exit the region; |
23
|
· |
shutdown of a financial system, communications network, or power grid causing a disruption to our business activities; and |
|
· |
capital market reassessment of risk and reduction of available capital making it more difficult for us and our partners to obtain financing for potential development projects. |
Loss of property and/or interruption of our business plans resulting from civil unrest could have a significant negative impact on our earnings and cash flow. In addition, we may not have enough insurance to cover any loss of property or other claims resulting from these risks.
Cyber-attacks targeting systems and infrastructure used by the oil and natural gas industry may adversely impact our operations.
Our business has become increasingly dependent on digital technologies to conduct certain exploration, development, production and financial activities. We depend on digital technology to estimate quantities of oil and natural gas reserves, process and record financial and operating data, analyze seismic and drilling information, and communicate with our employees and third party partners. Unauthorized access to our seismic data, reserves information or other proprietary information could lead to data corruption, communication interruption, or other operational disruptions in our exploration or production operations. Also, computers control nearly all of the oil and natural gas distribution systems in the U.S. and abroad, which are necessary to transport our production to market. A cyber-attack directed at oil and natural gas distribution systems could damage critical distribution and storage assets or the environment, delay or prevent delivery of production to markets and make it difficult or impossible to accurately account for production and settle transactions. While we have not experienced significant cyber-attacks, there is no assurance that we will not suffer such attacks and resulting losses in the future. Further, as cyber-attacks continue to evolve, we may be required to expend significant additional resources to continue to modify or enhance our protective measures or to investigate and remediate any vulnerability to cyber-attacks.
We rely on a single purchaser of our Gabon production, which could have a material adverse effect on our results of operations.
We currently sell our crude oil production from Gabon under a term contract with Glencore at pricing based upon an average of Dated Brent in the month of lifting, adjusted for location and market factors, that ends in July 2016.
Competitive industry conditions may negatively affect our ability to conduct operations.
The oil and natural gas industry is intensely competitive. We compete with, and may be outbid by, competitors in our attempts to acquire exploration and production rights in oil and natural gas properties. These properties include exploration prospects as well as properties with proved reserves. There is also competition for contracting for drilling equipment and the hiring of experienced personnel. Factors that affect our ability to compete in the marketplace include:
|
· |
our access to the capital necessary to drill wells and acquire properties; |
|
· |
our ability to acquire and analyze seismic, geological and other information relating to a property; |
|
· |
our ability to retain and hire the personnel necessary to properly evaluate seismic and other information relating to a property; |
|
· |
our ability to retain and hire experienced personnel, especially for our engineering, geoscience and accounting departments; and; |
|
· |
the location of, and our ability to access, platforms, pipelines and other facilities used to produce and transport oil and natural gas production. |
Our competitors include major integrated oil companies and substantial independent energy companies, many of which possess greater financial, technological, personnel and other resources than we do. These companies may be able to pay more for oil and natural gas properties, evaluate, bid for and purchase a greater number of properties than our financial or human resources permit, and may be better able than we are to continue drilling during periods of low oil and natural gas prices, to contract for drilling equipment and to secure trained personnel. Our competitors may also use superior technology which we may be unable to afford or which would require costly investment by us in order to compete.
Weather, unexpected subsurface conditions and other unforeseen operating hazards may adversely impact our oil and natural gas activities.
The oil and natural gas business involves a variety of operating risks, including fire, explosions, blow-outs, pipe failure, casing collapse, abnormally pressured formations and environmental hazards such as oil spills, natural gas leaks, ruptures and discharges of toxic gases, underground migration and surface spills or mishandling of fracture fluids including chemical additives, the occurrence of any of which could result in substantial losses to us due to injury and loss of life, severe damage to and destruction of property, natural resources and equipment, pollution and other environmental damage, clean-up responsibilities, regulatory investigation and penalties and suspension of operations. Our production facilities are also subject to hazards inherent in marine operations, such as capsizing, sinking, grounding, collision and damage from severe weather conditions. The relatively deep offshore drilling conducted by us overseas involves increased drilling risks of high pressures and mechanical difficulties, including stuck pipe, collapsed casing and separated cable. The impact that any of these risks may have upon us is increased due to the low number of producing properties we own.
We maintain insurance against some, but not all, potential risks; however, there can be no assurance that such insurance will be adequate to cover any losses or exposure for liability. The occurrence of a significant unfavorable event not fully covered by insurance could have
24
a material adverse effect on our financial condition, results of operations and cash flows. Furthermore, we cannot predict whether insurance will continue to be available at a reasonable cost or at all.
Significant physical effects of climate change have the potential to damage our facilities, disrupt our production activities and cause us to incur significant costs in preparing for or responding to those effects.
In interpretive guidance on climate change disclosure, the SEC indicates that climate change could have an effect on the severity of weather (including hurricanes and floods), sea levels, the arability of farmland, and water availability and quality. If such effects were to occur, our exploration and production operations have the potential to be adversely affected. Potential adverse effects could include damages to our facilities from powerful winds or rising waters in low-lying areas, disruption of our production activities because of climate-related damages to our facilities and our costs of operation potentially arising from such climatic effects, less efficient or non-routine operating practices necessitated by climate effects or increased costs for insurance coverages in the aftermath of such effects. Significant physical effects of climate change could also have an indirect effect on our financing and operations by disrupting the transportation or process-related services provided by midstream companies, service companies or suppliers with whom we have a business relationship. We may not be able to recover through insurance some or any of the damages, losses or costs that may result from potential physical effects of climate change. If drought conditions were to occur, our ability to obtain water could be impacted and in turn, our ability to perform hydraulic fracturing operations could be restricted or made more costly.
We may not have enough insurance to cover all of the risks we face and operators of prospects in which we participate may not maintain or may fail to obtain adequate insurance.
Our business is subject to all of the operating risks normally associated with the exploration for and production, gathering, processing, and transportation of oil and natural gas, including blowouts, cratering and fire, any of which could result in damage to, or destruction of, oil and natural gas wells or formations, production facilities, and other property, as well as injury to persons. For protection against financial loss resulting from these operating hazards, we maintain insurance coverage, including insurance coverage for certain physical damage, blowout/control of a well, comprehensive general liability, and worker’s compensation and employer’s liability. However, our insurance coverage may not be sufficient to cover us against 100% of potential losses arising as a result of the foregoing, and for certain risks, such as political risk, nationalization, business interruption, war, terrorism, and piracy, for which we have limited or no coverage. In addition, we are not insured against all risks in all aspects of our business, such as hurricanes. The occurrence of a significant event against which we are not fully insured could have a material adverse effect on our consolidated financial position, results of operations, or cash flows.
Our reserve information represents estimates that may turn out to be incorrect if the assumptions upon which these estimates are based are inaccurate. Any material inaccuracies in these reserve estimates or underlying assumptions will materially affect the quantities and present values of our reserves.
There are numerous uncertainties inherent in estimating quantities of proved oil and natural gas reserves, including many factors beyond our control. Reserve engineering is a subjective process of estimating the underground accumulations of oil and natural gas that cannot be measured in an exact manner. The estimates included in this document are based on various assumptions required by the SEC, including unescalated prices and costs and capital expenditures subsequent to December 31, 2015, and, therefore, are inherently imprecise indications of future net revenues. Actual future production, revenues, taxes, operating expenses, development expenditures and quantities of recoverable oil and natural gas reserves may vary substantially from those assumed in the estimates. Any significant variance in these assumptions could materially affect the estimated quantity and value of our reserves.
In addition, our reserves may be subject to downward or upward revision based upon production history, results of future development, availability of funds to acquire additional reserves, prevailing oil and natural gas prices and other factors. Moreover, the calculation of the estimated present value of the future net revenue using a 10% discount rate as required by the SEC is not necessarily the most appropriate discount factor based on interest rates in effect from time to time and risks associated with our reserves or the oil and natural gas industry in general. It is also possible that reserve engineers may make different estimates of reserves and future net revenues based on the same available data.
The estimated future net revenues attributable to our net proved reserves are prepared in accordance with current SEC guidelines, and are not intended to reflect the fair market value of our reserves. In accordance with the rules of the SEC, our reserve estimates are prepared using an average of beginning of month prices received for oil and natural gas for the preceding twelve months. Future reductions in prices below the average calculated for 2015 would result in the estimated quantities and present values of our reserves being reduced.
A substantial portion of our proved reserves are or will be subject to service contracts, production sharing contracts and other arrangements. The quantity of oil and natural gas that we will ultimately receive under these arrangements will differ based on numerous factors, including the price of oil and natural gas, production rates, production costs, cost recovery provisions and local tax and royalty regimes. Changes in many of these factors do not affect estimates of U.S reserves in the same way they affect estimates of proved reserves in foreign jurisdictions, or will have a different effect on reserves in foreign countries than in the U.S. As a result, proved reserves in foreign jurisdictions may not be comparable to proved reserve estimates in the U.S.
25
Our results of operations, financial condition, cash flows and compliance with debt covenants could be adversely affected by changes in currency exchange rates.
We are exposed to foreign currency risk from our foreign operations. While oil sales are denominated in U.S. dollars, portions of our costs in Gabon and Angola are denominated in the local currency. A weakening U.S. dollar will have the effect of increasing costs while a strengthening U.S. dollar will have the effect of reducing operating costs. The Gabon local currency is tied to the Euro. The exchange rate between the Euro and the U.S. dollar has fluctuated widely in recent years in response to international political conditions, general economic conditions, the European sovereign debt crisis and other factors beyond our control. Our results of operations, financial condition, cash flows and compliance with debt covenants could be adversely affected by such fluctuations in currency exchange rates.
Fluctuations in currency exchange rates may negatively impact our earnings, which are subject to financial covenants under our revolving credit facility. Failure to maintain these covenants could preclude us from borrowing under our revolving credit facility and require us to immediately pay down any outstanding drawn amounts under the credit agreement, which could affect cash flows or restrict business. As of December 31, 2015, we were in compliance with all financial covenants under our credit facility.
We may be unable to integrate successfully the operations of any acquisitions with our operations, and we may not realize all the anticipated benefits of any future acquisitions.
Failure to successfully assimilate any acquisitions could adversely affect our financial condition and results of operations.
Further, unexpected costs and challenges may arise whenever businesses with different operations or management are combined, and we may experience unanticipated delays in realizing the benefits of an acquisition. If we consummate any future acquisition, our capitalization and results of operation may change significantly, and you may not have the opportunity to evaluate the economic, financial and other relevant information that we will consider in evaluating future acquisitions.
Properties that we buy may not produce as projected, and we may be unable to determine reserve potential, identify liabilities associated with the properties or obtain protection from sellers against such liabilities, which could result in material liabilities and adversely affect our financial condition.
One of our growth strategies is to capitalize on opportunistic acquisitions of oil and natural gas reserves. Any future acquisition will require an assessment of recoverable reserves, title, future oil and natural gas prices, operating costs, potential environmental hazards, potential tax and employer liabilities, and other liabilities and similar factors. Ordinarily, our review efforts are focused on the higher valued properties and are inherently incomplete because it generally is not feasible to review in depth every potential liability on each individual property involved in each acquisition. Even a detailed review of records and properties may not necessarily reveal existing or potential problems, nor will it permit a buyer to become sufficiently familiar with the properties to assess fully their deficiencies and potential. Inspections may not always be performed on every well, and potential problems, such as ground water contamination and other environmental conditions and deficiencies in the mechanical integrity of equipment are not necessarily observable even when an inspection is undertaken. Any unidentified problems could result in material liabilities and costs that negatively impact our financial condition.
Additional potential risks related to acquisitions include, among other things:
|
· |
incorrect assumptions regarding the future prices of oil and natural gas or the future operating or development costs of properties acquired; |
|
· |
the risk that oil and natural gas reserves acquired may not be of the anticipated magnitude or may not be developed as anticipated; |
|
· |
difficulties in the assimilation of the assets and operations of the acquired business, especially if the assets acquired are in a new business segment or geographic area; |
|
· |
the assumption of liabilities; |
|
· |
limitations on rights to indemnity from the seller; |
|
· |
the diversion of management’s attention from other business concerns; |
|
· |
losses of key employees at the acquired businesses; |
|
· |
operating a significantly larger combined organization and adding operations; |
|
· |
the failure to realize expected profitability or growth; |
|
· |
the failure to realize expected synergies and cost savings; and |
|
· |
coordinating or consolidating corporate and administrative functions. |
If we consummate any future acquisitions, our capitalization and results of operations may change significantly.
Compliance with environmental and other government regulations could be costly and could negatively impact production.
The laws and regulations of the U.S., Gabon, Angola and Equatorial Guinea regulate our current business. These laws and regulations may require that we obtain permits for our development, limit or prohibit drilling activities in certain protected or sensitive areas, or restrict the substances that can be released in connection with our operations. Our operations could result in liability for personal injuries, property damage, natural resource damages, oil spills, discharge of hazardous materials, remediation and clean-up costs and other
26
environmental damages. Failure to comply with environmental laws and regulations may trigger a variety of administrative, civil and criminal enforcement measures, including the assessment of monetary penalties and the issuance of orders enjoining operations. In addition, we could be liable for environmental damages caused by, among others, previous property owners or operators of properties that we purchase or lease. Some environmental laws provide for joint and several strict liabilities for remediation of releases of hazardous substances, rendering a person liable for environmental damage without regard to negligence or fault on the part of such person. As a result, we may incur substantial liabilities to third parties or governmental entities and may be required to incur substantial remediation costs. We could also be affected by more stringent laws and regulations adopted in the future, including any related to climate change and greenhouse gases and use of hydraulic fracturing fluids, resulting in increased operating costs. As a result, substantial liabilities to third parties or governmental entities may be incurred, the payment of which could have a material adverse effect on our financial condition, results of operations and liquidity. Additionally, more stringent GHG regulation could impact demand for oil and natural gas.
These laws and governmental regulations, which cover matters including drilling operations, taxation and environmental protection, may be changed from time to time in response to economic or political conditions and could have a significant impact on our operating costs, as well as the oil and natural gas industry in general. While we believe that we are currently in compliance with environmental laws and regulations applicable to our operations, no assurances can be given that we will be able to continue to comply with such environmental laws and regulations without incurring substantial costs.
If our assumptions underlying accruals for abandonment costs are too low, we could be required to expend greater amounts than expected.
Almost all of our producing properties are located offshore. The costs to abandon offshore wells may be substantial. For financial accounting purposes, we record the fair value of a liability for an asset retirement obligation in the period in which it is incurred and capitalize the related costs as part of the carrying amount of the long-lived assets. The estimated liability is reflected as Asset retirement obligation in the balance sheets.
As part of the Etame field production license, we are subject to a cash funding arrangement for the eventual abandonment of all offshore wells, platforms and facilities on the Etame Marin block. On an annual basis over the remaining life of the production license, we fund a portion of these estimated abandonment costs. The amount of cash funded through the end of a period is reflected separately from the asset retirement obligation under other long term assets as Abandonment funding and is non-refundable to us. See “Item 1. Business – Segment and Geographic Information –Gabon Segment—Etame Marin Block—Abandonment” for further information. If estimated abandonment costs were to increase in the future, we may be required to increase our funding of such costs.
From time to time we may hedge a portion of our production, which may result in our making cash payments or prevent us from receiving the full benefit of increases in prices for oil and natural gas.
We may reduce our exposure to the volatility of oil and natural gas prices by hedging a portion of our production. Hedging also prevents us from receiving the full advantage of increases in oil or natural gas prices above the maximum fixed amount specified in the hedge agreement. In a typical hedge transaction, we have the right to receive from the hedge counterparty the excess of the maximum fixed price specified in the hedge agreement over a floating price based on a market index, multiplied by the quantity hedged. If the floating price exceeds the maximum fixed price, we must pay the counterparty this difference multiplied by the quantity hedged even if we had insufficient production to cover the quantities specified in the hedge agreement. Accordingly, if we have less production than we have hedged when the floating price exceeds the fixed price, we must make payments against which there are no offsetting sales of production. If these payments become too large, the remainder of our business may be adversely affected.
The distressed financial conditions of one or more hedge providers could have an adverse impact on us in the event these hedge providers are unable to pay us amounts owed to us under one or more financial hedge transactions by which we have hedged our exposure to commodity price volatility.
From time to time, we may enter into financial hedge transactions to hedge or mitigate our exposure to the risks of commodity price volatility with respect to the crude oil or natural gas we produce and sell. Similarly, some credit agreement facilities will require that we enter into financial hedges with creditworthy hedge providers for a percentage of our anticipated oil and natural gas production in order to ensure that we are able to make debt service payments under such credit facilities if oil and natural gas prices fall. In such instances, the hedge provider will be obligated to make payments to us under such financial hedge transactions to the extent that the floating (market) price is below an agreed fixed (strike) price. Hedging agreements expose us to risk of financial loss if the counterparty to a hedging contract defaults on its contract obligations. This risk of counterparty performance is of particular concern given the disruptions that have occurred in the financial markets that led to sudden changes in counterparty’s liquidity and hence their ability to perform under their hedging contracts with us. We are unable to predict sudden changes in counterparty’s creditworthiness or ability to perform. Even if we do accurately predict sudden changes, our ability to negate the risk may be limited depending upon market conditions. If the creditworthiness of our counterparties deteriorates and results in their nonperformance, we could incur a significant loss.
The adoption of derivatives legislation by the U.S. Congress could have an adverse effect on our ability to use financial derivative instruments to reduce (hedge, manage or mitigate) the effect of commodity price, interest rate, and other cost volatilities associated with its business.
The Dodd-Frank Wall Street Reform and Consumer Protection Act (the “Dodd-Frank Act”), signed into law in 2010, establishes, among other provisions, federal oversight and regulation of the over-the-counter derivatives markets and entities, such as us, that participate in
27
those markets. The Dodd-Frank Act required the Commodities Futures Trading Commission (“CFTC”) and the Securities and Exchange Commission (“SEC”) to promulgate rules and regulations implementing the new legislation; although the CFTC and the SEC have issued final regulations in certain areas, final rules in other areas and the scope of relevant definitions and/or exemptions still remain to be finalized. In one of its rulemaking proceedings still pending under the Dodd-Frank Act, the CFTC issued on November 5, 2013, a proposed rule imposing position limits for certain futures and option contracts in the major energy markets and for swaps that are their economic equivalents. Certain specified types of hedging transactions are exempt from these position limits, provided that such hedging transactions satisfy the CFTC’s requirements for “bona fide hedging” transactions or positions. Similarly, the CFTC has issued a proposed rule regarding the capital that a swap dealer or major swap participant is required to post with respect to its swap business, but the CTFC has not yet issued a final rule. The CFTC issued a final rule on Margin requirements for uncleared swap transactions on January 6, 2016, which includes an exemption for commercial end-users entering into uncleared swaps in order to hedge commercial risks affecting their business from any requirement to post margin to secure their swap transactions that are hedging commercial risks. In addition, the CFTC has issued a final rule authorizing an exception for commercial end-users using swaps to hedge their commercial risks from the otherwise applicable mandatory obligation under the Dodd-Frank Act to clear all swap transactions through a derivatives clearing organization and to trade all such swaps on an exchange. The Dodd-Frank Act also imposes recordkeeping and reporting obligations on counterparties to swap transactions and other regulatory compliance obligations. All of the above regulations could increase the costs to us of entering into financial derivative transactions to hedge or mitigate our exposure to commodity price volatility and other commercial risks affecting our business.
While it is not possible at this time to predict when the CFTC will issue final rules applicable to position limits or capital requirements, depending on our ability to satisfy the CFTC’s requirements for a commercial end-user using swaps to hedge or mitigate our commercial risks, these rules and regulations may require us to comply with position limits and with certain clearing and trade-execution requirements in connection with our financial derivative activities. The Dodd-Frank Act may also require our current counterparties to financial derivative transactions to spin off some of their derivatives activities to separate entities, which may not be as creditworthy as the current counterparties, and may cause some entities to cease their current business as hedge providers. These changes could reduce the liquidity of the financial derivatives markets thereby reducing the ability of commercial end-users to have access to financial derivatives to hedge or mitigate their exposure to commodity price volatility. The Dodd-Frank Act and any new regulations could significantly increase the cost of derivative contracts (including through requirements to post collateral which could adversely affect our available capital for other commercial operations purposes), materially alter the terms of future swaps relative to the terms of our existing bilaterally negotiated financial derivative contracts, and reduce the availability of derivatives to protect against commercial risks we encounter.
Finally, the Dodd-Frank Act was intended, in part, to reduce the volatility of oil and natural gas prices, which some legislators attributed to speculative trading in derivatives and commodity instruments related to oil and natural gas. Our revenues could therefore be adversely affected if a consequence of the Dodd-Frank Act and regulations is to lower commodity prices. Any of these consequences could have a material adverse effect on our ability to hedge risks and on our consolidated financial position, results of operations, or cash flows.
Certain U.S. federal income tax preferences currently available with respect to oil and natural gas production may be eliminated as a result of future legislation.
In recent years, the U.S. government’s budget proposals and other proposed legislation have included the elimination of certain key U.S. federal income tax incentives currently available to oil and natural gas exploration and production. If enacted into law, these proposals would eliminate certain tax preferences applicable to taxpayers engaged in the exploration or production of natural resources. These changes include, but are not limited to (i) the repeal of the percentage depletion allowance for oil and natural gas properties, (ii) the elimination of current deductions for intangible drilling and development costs, (iii) the elimination of the deduction for U.S. production activities and (iv) the increase in the amortization period from two years to seven years for geophysical costs paid or incurred in connection with the exploration for or development of, oil and natural gas within the U.S. It is unclear whether any such changes will be enacted or how soon any such changes would become effective. The passage of any legislation as a result of these proposals or any other similar changes in U.S. federal income tax laws could negatively affect our financial condition and results of operations.
We have received an audit report related to our Etame Marin block operations from the Gabon Taxation Department, and an adverse result of the audit could result in a material liability and adversely affect our financial condition.
In October 2014, we received a provisional audit report related to our Etame Marine block operations from the Gabon Taxation Department as part of a special industry-wide audit of business practices and financial transactions in Gabon. In November 2014, we responded to the Gabon Taxation Department requesting joint meetings to advance the resolution of this matter and later provided a formal reply to the provisional audit report in February 2015. A tentative agreement was reached with the Gabon Taxation Department in April 2015, and we are working with the Gabon Taxation Department to finalize the audit. During 2015, we accrued an estimated settlement of $0.3 million based upon preliminary negotiations. The ultimate outcome of the claim and impact cannot be predicted, and an adverse result of the audit could result in a material liability and adversely affect our financial condition.
There are inherent limitations in all control systems, and misstatements due to error or fraud that could seriously harm our business may occur and not be detected.
Our management, including our Chief Executive Officer and Chief Financial Officer, do not expect that our internal controls and disclosure controls will prevent all possible error and all fraud. A control system, no matter how well conceived and operated, can provide only reasonable, not absolute, assurance that the objectives of the control system are met. In addition, the design of a control
28
system must reflect the fact that there are resource constraints and the benefit of controls must be relative to their costs. Because of the inherent limitations in all control systems, an evaluation of controls can only provide reasonable assurance that all material control issues and instances of fraud, if any, in our company have been detected. These inherent limitations include the realities that judgments in decision-making can be faulty and that breakdowns can occur because of simple error or mistake. Further, controls can be circumvented by the individual acts of some persons or by collusion of two or more persons. The design of any system of controls is based in part upon certain assumptions about the likelihood of future events, and there can be no assurance that any design will succeed in achieving its stated goals under all potential future conditions. Because of inherent limitations in a cost-effective control system, misstatements due to error or fraud may occur and not be detected. A failure of our controls and procedures to detect error or fraud could seriously harm our business and results of operations.
Item 1B. Unresolved Staff Comments
None.
The location and general character of our principal oil and natural gas assets, production facilities, and other important physical properties have been described by segment under Item 1. Business. Information about oil and natural gas reserves, including the basis for their estimation, is discussed in “Item 1. Business.”
The Chancery Court of the State of Delaware held that our charter and bylaw provisions that allowed for director removal “for cause only” are invalid as a matter of Delaware law. The proceeding is still pending as to the plaintiffs’ request to recover their attorneys’ fees and costs.
On December 7, 2015, Plaintiff Vladimir Gusinsky Living Trust filed a stockholder class action lawsuit in the Court of Chancery of the State of Delaware (the “Court”) against the Company and all of its directors alleging that certain provisions of the Company’s Restated Charter and Second Amended and Restated Bylaws that restricted the removal of its directors to removal for cause only (the “director removal provisions”) were invalid as a matter of Delaware law. Plaintiff George Shapiro also filed a similar stockholder class action lawsuit in the Court on December 7, 2015. Thereafter, the plaintiffs agreed to the consolidation of their cases (the “Consolidated Case”).
After a hearing on the Consolidated Case on December 21, 2015, Vice Chancellor Laster issued an opinion in In re VAALCO Energy, Inc. Stockholder Litigation, Consol. C.A. No. 11775-VCL holding that, in the absence of a classified board or cumulative voting, the director removal provisions conflicted with Section 141(k) of the Delaware General Corporation Law and are therefore invalid. No appeal to the ruling has been made and the Company has no plans for such action.
Lastly, while the central issue stated in the preceding paragraph in regard to the Consolidated Case has been resolved, the plaintiffs still maintain a pending request in the Court to recover their attorneys’ fees and costs associated with the Consolidated Case.
Item 4. Mine Safety Disclosures
Not applicable.
Item 5. Market for Registrant’s Common Equity, Related Stockholder Matters and Issuer Purchases of Equity Securities
GENERAL
Our common stock is traded on the New York Exchange under the symbol EGY. The following table sets forth the range of high and low sales prices of the common stock for the periods indicated.
|
Period |
High |
Low |
||||
|
2015: |
||||||
|
First Quarter |
$ |
6.20 |
$ |
2.45 | ||
|
Second Quarter |
2.60 | 2.00 | ||||
|
Third Quarter |
2.12 | 1.28 | ||||
|
Fourth Quarter |
2.30 | 1.34 | ||||
|
2014: |
||||||
|
First Quarter |
$ |
8.55 |
$ |
5.93 | ||
|
Second Quarter |
9.22 | 6.29 | ||||
|
Third Quarter |
9.42 | 6.77 | ||||
|
Fourth Quarter |
8.68 | 4.14 | ||||
29
On February 29, 2016, the last reported sale price of the common stock on the New York Stock Exchange was $1.06 per share.
As of February 29, 2016, based upon information received from our transfer agent and brokers and nominees, there were approximately 59 holders of record of VAALCO common stock. This number does not include owners for whom common stock may be held in “street” names.
Dividends
We have not paid cash dividends and do not anticipate paying cash dividends on the common stock in the foreseeable future.
Performance Graph
The following graph compares the yearly percentage change in our cumulative total stockholder return on common shares with the cumulative total return of the S&P 500 Index and the SPDR S&P Oil & Gas Exploration and Production Index. For this purpose, the yearly percentage change in our cumulative total stockholder return is calculated by dividing (a) the sum of the dividends paid during the “measurement period,” and the difference between the price for our shares at the end and the beginning of the measurement period, by (b) the price for our common shares at the beginning of the measurement period. “Measurement period” means the period beginning at the market close on the last trading day before the beginning of our fifth preceding fiscal year, through and including the end of our most recently completed fiscal year. We were first listed on the New York Stock Exchange on October 12, 2006.
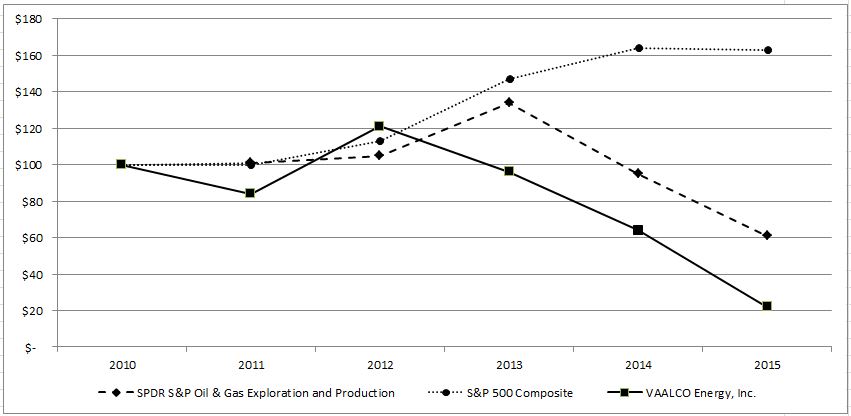
|
2010 |
2011 |
2012 |
2013 |
2014 |
2015 |
|||||||||||||
|
SPDR S&P Oil & Gas Exploration and Production |
$ |
100 |
$ |
101 |
$ |
105 |
$ |
134 |
$ |
95 |
$ |
61 | ||||||
|
S&P 500 Composite |
$ |
100 |
$ |
100 |
$ |
113 |
$ |
147 |
$ |
164 |
$ |
163 | ||||||
|
VAALCO Energy, Inc. |
$ |
100 |
$ |
84 |
$ |
121 |
$ |
96 |
$ |
64 |
$ |
22 | ||||||
30
Securities Authorized for Issuance under Equity Compensation Plans
The following table provides information as of December 31, 2015 regarding the number of shares of common stock that may be issued under our compensation plans. Please refer to Note 10 to the consolidated financial statements for additional information on stock based compensation.
|
Number of securities remaining |
|||||||
|
Number of securities to |
Weighted-average |
available for future issuance under |
|||||
|
be issued upon exercise |
exercise price of |
equity compensation plans (excluding |
|||||
|
of outstanding options, |
outstanding options, |
securities reflected in the first |
|||||
|
Plan Category |
warrants and rights |
warrants and rights |
column) |
||||
|
Equity compensation plans approved |
3,213,615 |
$ |
5.93 | 3,591,885 | |||
|
Equity compensation plans not |
930,300 |
$ |
8.07 | 965,300 | |||
|
Total |
4,143,915 |
$ |
6.41 | 4,557,185 | |||
Issuer Purchases of Equity Securities for Year Ended December 31, 2015
During 2015, we acquired 120,455 shares in cashless stock option exercises and to satisfy tax withholding obligations related to stock option exercises.
31
Item 6. Selected Financial Data
The following table sets forth, as of the dates and for the periods indicated, selected financial information. The financial information for each of the five years ended December 31, 2015, 2014, 2013, 2012 and 2011 has been derived from the Consolidated Financial Statements filed in the Annual Report on Form 10-K for each year. The information should be read in conjunction with “Item 7—Management’s Discussion and Analysis of Financial Condition and Results of Operations” and the Consolidated Financial Statements and Notes thereto. The following information is not necessarily indicative of future results.
|
Years Ended December 31, |
||||||||||||||||
|
2015 |
2014 |
2013 |
2012 |
2011 |
||||||||||||
|
(In thousands, except per share amounts) |
||||||||||||||||
|
Total revenues |
$ |
80,445 |
(1) |
$ |
127,691 |
(1) |
$ |
169,277 |
$ |
195,287 |
$ |
210,436 | ||||
|
Net income (loss) |
(158,656) |
(2) |
(77,550) |
(2) |
43,072 | 5,339 | 40,562 | |||||||||
|
Net income (loss) attributable to VAALCO Energy, Inc. |
(158,656) |
(2) |
(77,550) |
(2) |
43,072 | 631 |
(3) |
34,145 |
(3) |
|||||||
|
Basic net income (loss) per share attributable to |
(2.72) | (1.36) | 0.75 | 0.01 | 0.60 | |||||||||||
|
Diluted net income (loss) per share attributable to |
(2.72) | (1.36) | 0.74 | 0.01 | 0.59 | |||||||||||
|
Net property, plant and equipment |
33,373 |
(4) |
108,124 |
(4) |
138,524 | 106,608 | 99,848 | |||||||||
|
Total assets |
123,958 |
(4) |
248,849 |
(4) |
308,167 | 267,956 | 275,015 | |||||||||
|
Total debt |
15,000 | 15,000 |
- |
- |
- |
|||||||||||
(1)The decrease in total revenues is tied to the decrease in oil and natural gas prices that began in the 2014 and continued throughout 2015. See Item 7—Management’s Discussion and Analysis of Financial Condition and Results of Operations—Results of Operations below for discussion of how price decreases and sales volume increases impacted revenues.
(2)Net loss in 2014 and 2015 was primarily impacted by decreased revenues and oil and natural gas property impairments.
(3)We acquired the noncontrolling interest in VAALCO Energy (International), Inc. in October 2012.
(4)Net property, plant and equipment and Total assets decreased substantially in 2014 and 2015 due to impairments. See Note 5 to the consolidated financial statements for discussion of impairments.
Item 7. Management’s Discussion and Analysis of Financial Condition and Results of Operations
INTRODUCTION
VAALCO is a Houston-based independent energy company principally engaged in the acquisition, exploration, development and production of crude oil and natural gas. We own producing properties and conduct exploration activities as operator in Gabon, West Africa; we conduct exploration activities as an operator in Angola, West Africa, and we participate in exploration and development activities as a non-operator in Equatorial Guinea, West Africa. In the U.S., we operate unconventional resource properties in North Texas and hold undeveloped leasehold acreage in Montana. We also own minor interests in conventional production activities as a non-operator in the U.S. “Item 1—Business—Segment and Geographic Information” for a full discussion of recent development activities, production and future plans for our areas of operation and exploration.
A significant component of our results of operations is dependent upon the difference between prices received for our offshore Gabon oil production and the costs to find and produce such oil. Oil and natural gas prices have been and are expected in the future to be volatile and subject to fluctuations based on a number of factors beyond our control. Beginning in the third quarter of 2014, the prices for oil and natural gas began a dramatic decline which continued through 2015 and into 2016. Sustained low oil and natural gas prices or further decreases in oil and natural gas prices have had a material adverse effect on our financial condition, the carrying value of our proved reserves, our undeveloped leasehold interests and the borrowing base under our IFC credit facility. See”—Going Concern” below. As with prices received for oil production, the costs to find and produce oil and natural gas are largely not within our control.
CURRENT DEVELOPMENTS
In 2015, prices for oil, natural gas and natural gas liquids continued to decline, and they continue to remain low by historical standards. These low prices have affected our business in numerous ways, including causing:
|
· |
a material reduction in our revenues, cash flows and liquidity; |
|
· |
a reduction in the borrowing base of our revolving credit facility from $65 million to $20.1 million, with $15 million drawn at December 31, 2015; |
|
· |
a decrease in the valuation of our proved reserves and additional impairments of our oil and natural gas properties and the possibility that some of our existing wells may become uneconomic; |
|
· |
the removal of proved undeveloped drilling locations from our total proved reserves as a result of their becoming uneconomic to drill and develop; and |
|
· |
an increase in the possibility that the purchaser of our oil and natural gas production, or some of the companies that provide us with services, may experience financial difficulties. |
32
Price declines have also adversely affected the semi-annual determinations of the amounts we can borrow under our IFC revolving credit facility, since that determination is based mainly on the value of our oil and natural gas reserves. These reductions have limited our ability to carry out our operations. In March 2016, we announced that the IFC had redetermined our borrowing base, reducing it from $65.0 million to $20.1 million effective as of December 31, 2015. In addition, the IFC communicated to us that if we were to seek additional drawdowns before the next redetermination date (as of June 30, 2016), the IFC could elect, under the terms of the loan agreement, to conduct an interim redetermination, which it believes could result in a borrowing base of less than $20.1 million if prevailing commodity prices are lower than they were at December 31, 2015.
In January 2016, our Board of Directors formed a strategic committee to oversee the evaluation of our strategic alternatives and engaged a financial advisor. The strategic alternatives process will explore options for our future including, but not limited to, securing additional investment to support existing projects and growth opportunities, joint ventures, asset sales or farm-outs, our potential sale or merger, or continuing to pursue our existing operating plan. We will continue to pursue ways to increase liquidity and increase activity within our asset base. However, we can give no assurances that any of these strategic alternatives can be completed, and if so, on reasonable terms that are acceptable to us.
As discussed in Note 5 to the consolidated financial statements, we recorded impairments of our proved properties in each quarter of 2015. It is difficult to predict with reasonable certainty the amount of expected future impairments given the many factors impacting the calculation including, but not limited to, future pricing, operating costs, drilling and completion costs, and reserve additions and adjustments. The impairment calculations for this and previous periods have been based upon reserve economics using forecasted future prices, adjusted for specifics related to our production. We may experience additional write-downs in the future. If per barrel prices had been $5.00 lower, our fourth quarter impairment would have increased by approximately $8.4 million. Given the uncertainty associated with the factors used in these calculations, these estimates should not necessarily be construed as indicative of our future financial results.
In light of the depressed levels in oil prices, we intend to focus on maintaining oil production and lowering operating costs with respect to current production in our Etame Marin block located offshore Gabon in which our working interest is 28.1%. We have determined that additional development drilling is uneconomic at current commodity prices. Development drilling may become economic in the future when prices recover. In January 2016, we began demobilizing the Constellation II rig and no longer intend to drill any wells in 2016 on the Etame Marin block. See “Item 1—Business—Segment and Geographic Information—Gabon Segment” for discussion of recent development activities, production and future plans for fields in the Etame Marin block.
GOING CONCERN
Our revenues, cash flow, profitability, oil and natural gas reserves value and future rate of growth are substantially dependent upon prevailing prices for oil and natural gas. Our ability to borrow funds and to obtain additional capital on attractive terms is also substantially dependent on oil and natural gas prices. Historically, world-wide oil and natural gas prices and markets have been volatile, and may continue to be volatile in the future. In particular, the prices of oil and natural gas declined dramatically in the second half of 2014 and remained low, decreasing further in 2015. Average prices for our crude oil sales have decreased since the fall of 2014 from $103.23 per barrel in June 2014 to $33.56 per barrel in December 2015. As a result, our revenues have decreased from $127.7 million for the year ended December 31, 2014 to $80.4 million for the year ended December 31, 2015. Revenues for the year ended December 31, 2015 would have been approximately $56 million had they been sold at the same price realized for the December 2015 oil lifting.
Continued depressed oil and natural gas prices or further declines in oil and natural gas prices for 2016 and thereafter would have a material adverse effect on our liquidity, financial condition, results of operations and on the carrying value of our proved reserves.
If oil and natural gas prices continue to remain at current depressed levels, we expect that for 2016 we will not generate adequate revenue to cover our operating expenses, we will generate losses from operations, and our cash flows will not be sufficient to cover our operating expenses. To meet our capital needs, we are considering multiple alternatives, including, but not limited to, additional debt or equity financing, a sale or farm-downs of assets, delay of the discretionary portion of our capital spending to future periods or operating cost reductions. There can be no guarantee of future capital acquisition or fundraising success. Our current cash position and our ability to access additional capital may limit our available opportunities, or not provide sufficient cash available for our operations which raises substantial doubt about our ability to continue as a going concern.
33
Our financial statements for the year ended December 31, 2015, have been prepared on a going concern basis, which contemplates the realization of assets and the settlement of liabilities and commitments in the normal course of business. At current commodity prices, our ability to continue as a going concern is dependent on our ability to raise additional capital. The financial statements do not include any adjustments relating to the recoverability and classification of assets or the amounts and classification of liabilities that might be necessary should we be unable to continue as a going concern. See Note 2 to the consolidated financial statements for further information.
CAPITAL RESOURCES AND LIQUIDITY
Cash Flows
Our cash flows for the years 2015, 2014 and 2013 are as follows:
|
Year Ended December 31, |
Increase (Decrease) in the Year |
||||||||||||||
|
2015 Over |
2014 Over |
||||||||||||||
|
(in thousands) |
2015 |
2014 |
2013 |
(Under) 2014 |
(Under) 2013 |
||||||||||
|
Net cash provided by operating activities |
$ |
38,875 |
$ |
23,390 |
$ |
75,400 |
$ |
15,485 |
$ |
(52,010) | |||||
|
Net cash used in investing activities |
(83,010) | (101,398) | (67,944) | 18,388 | (33,454) | ||||||||||
|
Net cash provided by (used in) financing activities |
441 | 16,530 | (7,727) | (16,089) | 24,257 | ||||||||||
|
Net change in cash and cash equivalents |
$ |
(43,694) |
$ |
(61,478) |
$ |
(271) |
$ |
17,784 |
$ |
(61,207) | |||||
Net cash provided by operations increased by $15.5 million between 2014 and 2015. Working capital related changes contributed to a $64.1 million increase while the offsetting decrease of $48.6 million was primarily the result lower earnings between the periods. Net cash provided by operating activities decreased by $52.0 million between 2013 and 2014. Working capital related changes contributed to $25.1 million of this decrease and the remaining decrease was primarily a result of lower earnings between the periods.
Property and equipment expenditures are our most significant investing activities. During 2015, these expenditures on a cash basis were $88.9 million compared to $92.2 million and $66.9 million in 2014 and 2013. These cash property and equipment expenditures are included in capital expenditures. See “—Capital Expenditures” below for further discussion. In addition, restricted cash decreased by $5.5 million in 2015 because one commitment well, the Kindele #1, was drilled in Angola. Restricted cash increased $9.2 million increased in 2014 when funds for two additional Angola well commitments were designated as restricted due to drilling plans.
Net cash provided by financing activities included $0.4 million, $5.7 million and $3.7 million related to stock option exercises in 2015, 2014 and 2013 and the $15 million in borrowings under the IFC facility in 2014. Uses of cash included $2.3 million of debt issuance costs related to the IFC facility in 2014 and treasury stock purchases of $1.9 million and $11.5 million in 2014 and 2013.
Capital Expenditures
During 2015, our capital expenditures (on an accrual basis), including dry hole costs (“Capital Expenditures”) expended in the period, were $87.3 million compared to $65.9 million and $70.2 million in 2014 and 2013. The difference between capital expenditures and the property and equipment expenditures reported in the consolidated statements of cash flows is attributable to changes in accruals for costs incurred but not yet invoiced or paid on the report date. Capital Expenditures in 2015 were primarily associated with the drilling of five development wells offshore Gabon and the unsuccessful exploratory Kindele well offshore Angola. Capital Expenditures in 2014 and 2013 were primarily associated with the construction of the two new platforms offshore Gabon. In addition, 2014 Capital Expenditures included $9.2 million in dry hole costs related to one unsuccessful exploratory well drilled offshore Gabon, and 2013 included $19.2 million related to two unsuccessful exploratory wells in the U.S. and three offshore Gabon.
We have reduced our 2016 capital budget significantly from our 2015 capital budget to a range of $3 million to $6 million, which could be increased should commodity prices improve. Due to decreased levels of oil prices, we intend to focus on maintaining production and lowering operating costs with respect to current production in our Etame Marin block and have determined that additional development drilling is currently uneconomic. In 2016, we released the Constellation II rig and no longer intend to drill any wells in 2016 on our Etame Marin block offshore Gabon. We expect to incur fees of up to $7 million related to the contract period from the rig release date through its expiration, for which a liability will be recognized in the first quarter of 2016.
Liquidity
Historically, our primary sources of capital have been cash flows from operating activities and cash balance on hand. We also have access to capital through the IFC credit facility, as well as future sales of our debt and equity securities.
Credit Facility
We have a $65 million revolving credit facility with the IFC that is secured by the assets of our Gabon subsidiary, VAALCO Gabon (Etame), Inc. The borrowing base under the IFC credit facility is based upon our proved reserves and risk adjusted probable reserves and is re-determined semi-annually by the IFC: as of June 30 and December 31. In addition, the borrowing base may be adjusted pursuant to certain non-scheduled redeterminations. The borrowing base was redetermined effective December, 31, 2015 at $20.1 million, with
34
$15.0 million drawn at December 31, 2015. In addition, the IFC communicated to us that if we were to seek additional drawdowns before the next redetermination date (as of June 30, 2016), the IFC could elect, under the terms of the loan agreement, to conduct an interim redetermination, which it believes could result in a borrowing base of less than $20.1 million if commodity prices are lower than they were at December 31, 2015. Therefore, we currently have very limited borrowing capacity under our revolving credit facility.
Amounts outstanding under the IFC credit facility bear interest at the London InterBank Offered Rate (“LIBOR”) plus 3.75% for the senior tranche and LIBOR plus 5.75% for the subordinated tranche. We are also required to pay a commitment fee in respect of unutilized commitments, which is equal to 1.5% on the senior tranche and 2.3% on the subordinated tranche.
The loan agreement for the IFC credit facility provides that lending commitment amounts under the credit facility will begin decreasing on a semi-annual basis beginning June 30, 2016, and continue through December 2019. Under the loan agreement, the senior tranche commitment will decrease by $6.25 million and the subordinated tranche commitment will decrease by $1.88 million, every six months beginning effective June 30, 2016.
Our credit agreement contains a number of restrictive covenants that impose significant operating and financial restrictions on us. These covenants include restrictions on our ability to:
|
· |
incur additional indebtedness, guarantee debt or enter into any arrangement to assume or become obligated for financial or other obligations of another (except those pursuant to a joint operating agreement); |
|
· |
pay dividends on or make other distributions in respect of, or purchase or redeem, shares of our capital stock; |
|
· |
prepay, redeem or repurchase certain debt; |
|
· |
make loans, investments and other restricted payments; |
|
· |
sell, transfer or otherwise dispose of assets; |
|
· |
create or incur liens; |
|
· |
sell, transfer or lease all or a substantial part of our assets, other than inventory or depleted or obsolete assets in the ordinary course of our business; |
|
· |
enter into non-arm’s-length transactions; |
|
· |
incur or commit to make certain expenditures for fixed or other non-current assets; |
|
· |
enter into lease agreements or arrangements, other than the FPSO contract and leases necessary to carry on our business; |
|
· |
form any subsidiary; |
|
· |
terminate, amend or grant consents or waivers with respect to certain material contracts. |
|
· |
use the proceeds of loans other than as permitted by the credit agreement; |
|
· |
reduce certain of our working interests; |
|
· |
modify our organizational documents; |
|
· |
alter the business we conduct; |
|
· |
undertake or permit any merger, spin-off, consolidation or reorganization; and |
|
· |
enter into any derivative transaction without prior approval. |
In addition, the loan agreement includes certain financial ratios, including;
|
· |
a debt service coverage ratio of (i) net cash flows, plus the balance in an operating account) to (ii) debt service obligations, of at least 1.2:1 on the first day of the determination period; |
|
· |
loan-life coverage ratios with respect to (i) the present values of (a) projected net cash flow, plus (b) certain projected capital expenditures, to (ii) the aggregate amounts of the loans outstanding under the revolving credit facility in the determination period; |
|
· |
field-life coverage ratios with respect to (i) projected net cash flow up to a field-life end date for our reserves, to (ii) the aggregate amounts of the loans outstanding in the determination period; and |
|
· |
a ratio of (i) net debt as of the end of a fiscal quarter to (ii) earnings before interest, tax, depreciation and amortization, and exploration expenses (EBITDAX) for the trailing 12 months ended on the most recent quarter end, at less than 3.0:1. |
As of December 31, 2015, we were in compliance with all of our financial covenants under our revolving credit facility. However, we can make no assurance that we will be able to comply with these financial covenants in the future. Failure to maintain these covenants or otherwise to negotiate waivers or amendments to our revolving credit facility would likely preclude us from borrowing under the credit facility and require us to immediately pay down any outstanding drawn amounts under the facility.
These covenants restrict our ability to engage in certain actions, including potentially limiting our ability to sell assets, make future borrowings under the credit facility or incur other additional indebtedness. Our ability to meet our net debt to EBITDAX ratio and our different coverage ratios can be affected by events beyond our control, including changes in commodity prices. There can be no assurance that we will be able to comply with these covenants in future periods. In addition, if we receive any additional waivers or amendments to our revolving credit facility loan agreement, the lender may impose additional operating and financial restrictions on us or modify the terms of the loan agreement.
A breach of the covenants under our revolving credit facility loan agreement could result in an event of default under the agreement. Such a default may allow the lender to accelerate payment of the indebtedness under the facility and may result in the acceleration of any other indebtedness to which a cross-acceleration or cross-default provision applies. Furthermore, if we were unable to repay the amounts
35
due and payable under the revolving credit facility the lender could proceed against the collateral granted to it to secure that indebtedness.
Cash on Hand
At December 31, 2015, we had unrestricted cash of $25.4 million. We invest cash not required for immediate operational and capital expenditure needs in short-term bankers acceptance and money market instruments primarily with JPMorgan Chase & Co. As operator of fields in the Etame Marin block, we enter into contracts related to operations and development projects on behalf of our working interest partners. We generally obtain advances from these partners prior to significant funding commitments.
Share Repurchase
On August 4, 2015, we announced that our Board of Directors authorized a share repurchase program allowing us to repurchase up to approximately 5.8 million shares of our common stock through February 3, 2017. Under the share repurchase program, the common stock could be purchased on the open market, in privately negotiated transactions or otherwise in compliance with all of the conditions of Rule 10b-18 under the Securities Exchange Act of 1934, as amended. The timing of the common stock repurchased will be at the discretion of management and will depend on a number of factors, including price, market conditions and regulatory requirements. We retain the right to limit, terminate or extend the share repurchase program at any time without prior notice. Payment for shares repurchased under the program will be from cash on hand. No purchases were made under this share repurchase program during 2015.
Contractual Obligations
Cash Obligations
The table below provides aggregated information on our net share of cash obligations and commitments at December 31, 2015:
|
2016 |
2017 |
2018 |
2019 |
2020 |
Thereafter |
Total |
|||||||||||||||
|
(in thousands) |
|||||||||||||||||||||
|
IFC Credit Facility (1) |
$ |
- |
$ |
- |
$ |
- |
$ |
15,000 |
$ |
- |
$ |
- |
$ |
15,000 | |||||||
|
Operating leases (2) |
12,319 | 10,212 | 9,140 | 8,853 | 8,809 |
- |
49,333 | ||||||||||||||
|
Drilling rig(3) |
9,773 |
- |
- |
- |
- |
- |
9,773 | ||||||||||||||
|
Abandonment funding (4) |
2,600 | 2,100 | 2,100 | 1,300 | 1,300 | 1,300 | 10,700 | ||||||||||||||
|
Total cash obligations |
$ |
24,692 |
$ |
12,312 |
$ |
11,240 |
$ |
25,153 |
$ |
10,109 |
$ |
1,300 |
$ |
84,806 | |||||||
|
(1) |
See complete discussion of the facility above under “Credit Facility”. This presentation assumes the optional one year extension. Interest estimated to be paid on the IFC credit facility in each of 2016 through 2019 is $0.7 million, $0.7 million, $0.7 million and $0.5 million. |
|
(2) |
Included in these figures is our net share of charter payments for the FPSO used on the Etame Marin block. See “FPSO Charter” in Note 8 to the consolidated financial statements for further information. |
|
(3) |
Included are payments under a long-term drilling rig contract. See “Rig commitment” in Note 8 to the consolidated financial statements for further information about the long-term drilling rig contract. |
|
(4) |
See “Abandonment funding” in Note 8 to the consolidated financial statements for further information. |
Commitments and Uncertainties
Angola Offshore –Block 5
As discussed further under “Item 1. Business – Segment and Geographic Information – Angola Segment,” we signed a production sharing contract for Block 5, offshore Angola. VAALCO’s working interest is 40%. Additionally, we were required to carry the Angolan national oil company, Sonangol P&P, for 10% of the work program. Sonangol P&P also holds the remaining 50% working interest.
Due to its failure to pay amounts owed, we placed Sonangol P&P in default in the first quarter of 2015. As discussed further in Note 8 to the consolidated financial statements, on March 14, 2016, we received $19.0 million from Sonangol P&P as payment for the full amounts owed as of December 31, 2015.
Although Sonangol P&P’s payment in March 2016 resolves the long outstanding amounts owed, there continues to be uncertainty about the future exploration of Block 5. To date, we have not been successful in farming-down our interest in Block 5 and our current liquidity is preventing us from pursuing the project without a partner. Due to the above circumstances regarding our intent and ability to pursue further exploration activities in Angola, we are recording a full impairment totaling $8.2 million of our undeveloped leasehold in the fourth quarter of 2015, the offset being a charge to exploration expense, and writing off the $1.9 million in equipment inventory to Other operating income (loss), net.
In October 2014, we entered into the Subsequent Exploration Phase (“SEP”), together with our working interest partner, Sonangol P&P. The SEP extends the exploration period for an additional three year period such that the new expiry date for exploration activities is November 30, 2017. The SEP requires us and our partner to acquire 3D seismic and to drill two additional exploration wells. The seismic related commitment was completed in 2013. The two-well commitment under the primary exploration period carried over to the SEP period. In the first quarter of 2015, we drilled an unsuccessful exploratory well on the Kindele prospect, a post-salt objective, meeting one of the well commitments.
36
A $10.0 million dollar assessment ($5.0 million dollars net to VAALCO) applied to each of the three remaining commitment exploration wells for which drilling has not commenced before November 30, 2017. Due to the current outlook for oil prices and the uncertainties about the timing for our partner to pay its share of future costs, there may be delays in drilling the remaining three wells. We have continued to classify the $15.0 million commitment for drilling these wells as long term restricted cash on our balance sheet. We believe that it is not probable that we will incur any liability related to not meeting the commitment deadline to drill the three remaining wells as stated in the production sharing agreement with the Angolan government as the government has caused multiple delays in the Company obtaining a partner to participate in the future well commitments. We will seek to extend the term of the exploration license and hence the well commitment deadline in the coming months.
Gabon
In October 2014, we received a provisional audit report related to the Etame Marin block operations from the Gabon Taxation Department as part of a special industry-wide audit of business practices and financial transactions in Gabon. In November 2014, we responded to the Gabon Taxation Department requesting joint meetings to advance the resolution of this matter and later provided a formal reply to the provisional audit report in February 2015. A tentative agreement was reached with the Gabon Taxation Department in April 2015, and we are working with the Gabon Taxation Department to finalize the audit. During 2015, we accrued an estimated settlement of $0.3 million based upon preliminary negotiations. The ultimate outcome of the claim and impact cannot be predicted, and an adverse result of the audit could result in a material liability and adversely affect our financial condition.
The audit of 2011 and 2012 by the Directorate General of Hydrocarbons, which is responsible for implementation of oil policy and the management and development of oil and natural gas resources in Gabon, was fully resolved and settled in September 2015 for $0.3 million net to VAALCO.
OFF BALANCE SHEET ARRANGEMENTS
For a discussion of off balance sheet arrangements associated with our guarantee of the FPSO charter payments and the remaining maximum gross potential obligation, see “FPSO charter” in Note 8 to the consolidated financial statements.
RESULTS OF OPERATIONS
Year Ended December 31, 2015 Compared to Year Ended December 31, 2014
We reported a net loss for the year ended December 31, 2015 of $158.7 million compared to a net loss of $77.6 million for the same period of 2014. The 2015 and 2014 net losses are primarily attributable to non-cash proved property impairments and decreased revenues resulting from the severe decline in oil prices that began in 2014. 2015 was also impacted by dry hole expense from the Kindele #1, the write-off of suspended well costs related to the N’Gongui No. 2 and provisions for bad debt of $2.7 million. Further discussion of results by significant income line item follows.
Oil and natural gas revenues decreased $47.2 million during the year ended December 31, 2015 compared to the same period of 2014. The decrease in revenue is primarily related to significantly lower realized oil prices, which are due to decreases in the Dated Brent market price and an adverse increase in marketing differentials for our crude.
The portion of revenue changes between the years ended December 31, 2015 and 2014, identified as related to changes in price or volume, are shown in the table below:
|
2015 Over |
|||||||
|
(in thousands) |
(Under) 2014 |
||||||
|
Price |
$ |
(62,458) | |||||
|
Volume |
15,735 | ||||||
|
Other |
(523) | ||||||
|
$ |
(47,246) | ||||||
37
The table below shows net production, sales volumes and realized prices for both years.
|
Year Ended December 31, |
|||||||
|
2015 |
2014 |
||||||
|
Gabon net oil production (MBbls) |
1,656 | 1,417 | |||||
|
Gabon net oil sales (MBbls) |
1,679 | 1,348 | |||||
|
U.S. net oil sales (MBbls) |
3 | 3 | |||||
|
Net oil sales (MBbls) |
1,682 | 1,351 | |||||
|
Net natural gas sales (MMcf) |
181 | 227 | |||||
|
Net oil equivalents (MBOE) |
1,712 | 1,389 | |||||
|
Average realized oil price ($/Bbl) |
$47.85 | $93.66 | |||||
|
Average realized natural gas price ($/Mcf) |
2.21 | 4.57 | |||||
|
Weighted average realized price ($/BOE) |
47.24 | 91.86 | |||||
|
Average Europe Brent spot* ($/Bbl) |
52.32 | 98.97 | |||||
|
*Average of daily Europe Brent spot prices posted on the U.S. Energy Information Administration website. |
|||||||
Crude oil sales are a function of the number and size of crude oil liftings from the FPSO, and thus crude oil sales do not always coincide with volumes produced in any given period. We made 11 in both years. Our share of oil inventory aboard the FPSO, excluding royalty barrels, was approximately 34,000 and 84,000 barrels at December 31, 2015 and 2014.
Production expenses increased $8.4 million in the year ended December 31, 2015 compared to the same period of 2014. Production expenses included workover costs to replace electric submersible pumps (“ESPs”) which were $4.2 million in 2015 and $2.1 million in 2014. While the impact of cost reduction efforts began to be apparent in the latter part of 2015, overall production expenses are higher because they include $1.9 million related to studies to evaluate solutions for a centralized processing facility to remove H2S from the sour production on the block. Costs in 2015 were also impacted by increased production volumes. A decrease in the domestic market obligation for 2015 partially offset the cost increases.
Exploration expense increased $31.1 million in the year ended December 31, 2015 compared to the same period of 2014. Included in 2015 were costs for the Kindele #1 exploratory well drilled offshore Angola which was determined to be a dry hole in the first quarter of 2015 and $9.2 million of exploratory well costs incurred in 2012 related to the N’Gongui No. 2 discovery which was determined to be a dry hole expense in the third quarter of 2015. Included in 2014 was one exploratory dry hole drilled offshore Gabon. Also in 2015, we recorded impairments of $9.4 million related to undeveloped leasehold costs associated with Block 5 in Angola and Poplar Dome in the U.S. The following table shows exploration expense in detail.
|
Year Ended December 31, |
|||||||
|
(in thousands) |
2015 |
2014 |
|||||
|
Exploration expenses: |
|||||||
|
Dry hole costs |
$ |
33,519 |
$ |
9,214 | |||
|
Unproved leasehold impairment |
12,134 | 3,880 | |||||
|
Seismic |
626 | 1,747 | |||||
|
Other |
174 | 517 | |||||
|
Total exploration expenses |
$ |
46,453 |
$ |
15,358 | |||
Depreciation, depletion and amortization (“DD&A”) expenses increased $12.9 million in the year ended December 31, 2015 compared to the same period of 2014. Higher oil sales volumes in the year ended December 31, 2015 impacted the increase for 2015. With the completion of the Etame 12-H, the Southeast Etame 2-H and the North Tchibala 1-H and 2-H wells, the remaining Etame and SEENT platform costs were added to the depletable costs, increasing our rate of depletion per barrel. In addition, the reduction in proved reserves previously discussed increased our rate of depletion per barrel for the fourth quarter of 2015.
General and administrative expenses increased $0.6 million in the year ended December 31, 2015 compared to the same period of 2014. The increase in general and administrative expense was primarily related to increased stock compensation and professional fees.
General and administrative related to shareholder matters reflects costs incurred in connection to shareholder actions by Group 42, Inc., Bradley L. Radoff and certain other participants (collectively, the "Group 42-BLR Group"), which beneficially owns approximately 11.1% of the Company's outstanding stock and is related to shareholder litigation filed in Delaware as discussed further in Note 8 to the consolidated financial statements. In December 2015, we reached an agreement with the Group 42-BLR Group. The litigation in Delaware is ongoing.
Bad debt expense and other for both the years ended December 31, 2015 and 2014 includes bad debt expense related to Value Added Tax (“VAT”) which the government of Gabon is required to reimburse but has not paid.
38
Impairment of proved properties is discussed in detail in Note 5 to the consolidated financial statements. Declining forecasted oil prices in 2015 and 2014 caused us to record impairments of $81.3 million and $98.3 million, respectively. As discussed further in Notes 3 and 5 to the consolidated financial statements, the impairments includes a charge of $7.0 million in 2015 which is for the correction of an error in 2014 which caused the impairment in 2014 to be understated.
Other operating loss, net in 2015 consists primarily of impairments of capitalized equipment inventory located in Gabon and Angola. Our lack of success to-date in farming down our interest in Block 5 offshore Angola and our current liquidity is preventing us from pursuing the project without a partner; therefore, the $1.9 million in equipment inventory was written off. Equipment inventory in Gabon related to Mutamba was also written off because further drilling in the prospect is uneconomic, while equipment inventory related to the Etame Marin block was reduced in value due to obsolescence of some items.
Interest expense increased $1.3 million in the year ended December 31, 2015 compared to the same period of 2014. All interest expense incurred on the IFC credit facility was capitalized in the year ended December 31, 2014, while only a portion of the interest expense incurred could be capitalized in 2015. Costs associated with projects in progress and which are subject to capitalization of interest were significantly higher in 2014 as we had two platforms under construction during the period. See Note 7 to the consolidated financial statements for further discussion of interest expense.
Other, net consists primarily of foreign currency gains (losses). Because the U.S. dollar strengthened in 2015, net gains are reported for the year ended December 31, 2015 whereas a weaker U.S. dollar in 2014 created resulted in net losses.
Income tax expense decreased $7.9 million in the year ended December 31, 2015 compared to the same period of 2014. Income taxes paid to the government of Gabon are a function of taxation on the remaining profit oil value after deducting the royalty and the cost oil values. The decrease in income tax expense was primarily associated with the decrease in revenue due to the lower realized prices. Income tax for 2015 includes $1.4 million deferred expense associated with valuation allowance provided on Alternative Minimum Tax (“AMT”) credit carryforwards. The remaining income tax expense of $13.2 million is for income tax in Gabon and compares to income tax expense of $22.5 million in 2014, all of which was attributable to income tax expense in Gabon.
Year Ended December 31, 2014 Compared to Year Ended December 31, 2013
We reported a net loss for the year ended December 31, 2014 of $77.6 million compared to net income of $43.1 million for the same period of 2013. The net loss in 2014 is primarily attributable to decreased revenues resulting from the severe decline in oil prices, non-cash proved property impairments and increased exploration expenses. Further discussion of results by significant income line item follows.
Oil and natural gas revenues decreased $41.6 million the year ended December 31, 2014 compared to the same period of 2013. The decrease in revenue is primarily related to significantly lower realized oil prices, which are due to decreases in the Dated Brent market price and an adverse increase in marketing differentials for our crude. The portion of revenue changes between the years ended December 31, 2014 and 2013, identified as related to changes in price or volume, are shown in the table below:
|
2014 Over |
|||||||
|
(in thousands) |
(Under) 2013 |
||||||
|
Price |
$ |
(23,468) | |||||
|
Volume |
(18,765) | ||||||
|
Other |
647 | ||||||
|
$ |
(41,586) | ||||||
The table below shows net production, sales volumes and realized prices for both years.
|
Year Ended December 31, |
||||||
|
2014 |
2013 |
|||||
|
Gabon net oil production (MBbls) |
1,417 | 1,525 | ||||
|
Gabon net oil sales (MBbls) |
1,348 | 1,544 | ||||
|
U.S. net oil sales (MBbls) |
3 | 5 | ||||
|
Net oil sales (MBbls) |
1,351 | 1,549 | ||||
|
Net natural gas sales (MMcf) |
227 | 325 | ||||
|
Net oil equivalents (MBOE) |
1,389 | 1,603 | ||||
|
Average realized oil price ($/Bbl) |
$93.68 | $108.35 | ||||
|
Average realized natural gas price ($/Mcf) |
2.21 | 4.50 | ||||
|
Weighted average realized price ($/BOE) |
47.24 | 105.60 | ||||
|
Average Europe Brent spot* ($/Bbl) |
52.32 | 108.56 | ||||
|
*Average of daily Europe Brent spot prices posted on the U.S. Energy Information Administration website. |
||||||
39
Crude oil sales are a function of the number and size of crude oil liftings from the FPSO, and thus crude oil sales do not always coincide with volumes produced in any given quarter. We made 11 liftings in the year ended December 31, 2014, while we made 15 liftings in the same period of 2013. Our share of oil inventory aboard the FPSO, excluding royalty barrels, was approximately 84,000and 19,000 barrels at December 31, 2014 and 2013.
Production expenses decreased $4.9 million in the year ended December 31, 2014 compared to the same period of 2013. Production expenses included workover costs to replace ESPs, which were $2.1 million and $7.6 million in 2014 and 2013. Excluding workovers, production expense increased approximately $0.6 million.
Exploration expense decreased $8.6 million in the year ended December 31, 2014 compared to the same period of 2013. Lower dry hole costs are the primary reason. Included in 2014 was one exploratory dry hole drilled offshore Gabon. Included in 2013 were two exploratory dry holes drilled in the U.S. and two exploratory dry holes drilled offshore Gabon. The following table shows exploration expense in detail
|
Year Ended December 31, |
||||||
|
(in thousands) |
2014 |
2013 |
||||
|
Exploration expenses: |
||||||
|
Dry hole costs |
$ |
9,214 |
$ |
19,175 | ||
|
Unproved leasehold impairment |
3,880 | 3,052 | ||||
|
Geologic and seismic |
1,747 | 473 | ||||
|
Other |
517 | 1,228 | ||||
|
Total exploration expenses |
$ |
15,358 |
$ |
23,928 | ||
Depreciation, depletion and amortization (“DD&A”) expenses increased $3.2 million in the year ended December 31, 2014 compared to the same period of 2013 primarily as a result of higher rates of depletion per barrel for all fields.
General and administrative expenses increased $2.9 million in the year ended December 31, 2014 compared to the same period of 2013. The increase in general and administrative expense was primarily due to increased personnel, and higher support services costs.
Bad debt expense and other in 2014 is $2.4 million for Value Added Tax (“VAT”) which the government of Gabon is required to reimburse but has not paid. In 2013, other costs and expenses included an allowance related to the collectability of the receivable from its partner in Angola. As discussed further in Note 8, we recorded valuation allowances in 2011 through 2013 totaling $7.6 million due to the uncertainty of our ability to collect from a previous joint venture partner in Angola. Sonangol P&P assumed this obligation in 2014, and while they have agreed that they owe the amount, payment had not been made. As discussed further in Note 8 to the consolidated financial statements, on March 14, 2016, we received $19.0 million from Sonangol P&P as payment for the full amounts owed as of December 31, 2015, which included: (i) $8.1 million of partner receivables reported at December 31, 2015 (representing 2015 activity), (ii) the $7.6 million of unpaid costs assumed by Sonangol P&P when they were assigned the participating interest in January 2014, and (iii) $3.2 million of interest as a result of being in default which we have not previously recognized in our financial results. As of December 31, 2015, we had $8.1 million reflected in Accounts with partners, net of an allowance of $7.6 million. As a result of this payment received subsequent to December 31, 2015, net income (loss) for the first quarter of 2016 will reflect the benefit for the reversal of the $7.6 million allowance and the recognition of the $3.2 million of default interest.
Impairment of proved properties is discussed in detail in Note 5 to the consolidated financial statements. Declining forecasted oil prices in 2014 caused us to record impairments of $98.3 million in 2014. In 2013, no impairments were recorded. As discussed further in Notes 3 and 5 to the consolidated financial statements, the impairments recorded in 2015 include a charge of $7.0 million, which is for the correction of an error in 2014 which caused the impairment in 2014 to be understated.
Income tax expense decreased $11.6 million in the year ended December 31, 2014 compared to the same period of 2013. In both periods, all income taxes were paid for Gabonese income tax. Income taxes paid to the government of Gabon are a function of taxation on the remaining profit oil value after deducting the royalty and the cost oil values. The decrease in income tax expense is due to lower revenue resulting from lower sales volumes and prices, a significant increase in costs incurred due to the construction of two new platforms and cost incurred associated with the rigs under contract for the majority of 2014 in the Etame Marin block.
CRITICAL ACCOUNTING POLICIES AND ESTIMATES
The preparation of financial statements in accordance with accounting principles generally accepted in the U.S. (“GAAP”) requires us to make estimates and assumptions that affect the reported amounts of assets and liabilities and the disclosure of contingent assets and liabilities as of the date of the consolidated financial statements and the reported amounts of revenues and expenses during the respective reporting periods. Accounting estimates are considered to be critical if (1) the nature of the estimates and assumptions is material due to the levels of subjectivity and judgment necessary to account for highly uncertain matters or the susceptibility of such matters to change, and (2) the impact of the estimates and assumptions on financial condition or operating performance is material. Actual results could differ from the estimates and assumptions used. Further, in some cases, GAAP allows more than one alternative accounting method for reporting. In those cases, our reported results of operations would be different should we employ an alternative accounting method. See Note 3 to the consolidated financial statements for our accounting policy elections.
40
Successful Efforts Method of Accounting for Oil and Natural Gas Activities
We use the successful efforts method to account for our oil and natural gas activities. Management believes that this method is preferable, as we have focused on exploration activities wherein there is risk associated with future success and as such earnings are best represented by attachment to our drilling. Costs of successful wells, development dry holes and leases containing productive reserves are capitalized and amortized on a unit-of-production basis over the life of the related reserves. Other exploration costs, including dry exploration well costs, geological and geophysical expenses applicable to undeveloped leasehold, leasehold expiration costs and delay rentals are expensed as incurred.
We review our oil and natural gas producing properties for impairment on a field-by-field basis whenever events or changes in circumstances indicate that the carrying amount of such properties may not be recoverable. If the sum of the expected undiscounted future cash flows from the use of the asset and its eventual disposition is less than the carrying amount of the asset, an impairment charge is recorded based on the fair value of the asset. This may occur if a field contains lower than anticipated reserves or if commodity prices fall below a level that significantly effects anticipated future cash flows on the field. The fair value measurement used in the impairment test is generally calculated with a discounted cash flow model using several Level 3 inputs which are based upon estimates, the most significant of which is the estimate of net proved reserves. There are numerous uncertainties inherent in estimating quantities of proved reserves and in projecting future rates of production and timing of development expenditures, including many factors beyond our control. Reserve engineering is a subjective process of estimating underground accumulations of oil and natural gas that cannot be measured in an exact manner, and the accuracy of any reserve estimate is a function of the quality of available data and of engineering and geological interpretation and judgment. The quantities of oil and natural gas that are ultimately recovered, production and operating costs, the amount and timing of future development expenditures and future oil and natural gas sales prices may all differ from those assumed in these estimates.
Impairment of Unproved Property
We evaluate our undeveloped oil and natural gas leases for impairment on at least a quarterly basis by considering numerous factors that could include nearby drilling results, seismic interpretations, market values of similar assets, existing contracts and future plans for exploration or development. When undeveloped oil and natural gas leases are deemed to be impaired, exploration expense is charged. Unproved property costs consist of acquisition costs related to undeveloped acreage in Equatorial Guinea. See “Item 1—Business—Segment and Geographic Information—Equatorial Guinea Segment” for further information on our exploration plans in Equatorial Guinea.
Asset Retirement Obligations (“ARO”)
We have significant obligations to remove tangible equipment and restore land or seabed at the end of oil and natural gas production operations. Our removal and restoration obligations are primarily associated with plugging and abandoning wells, removing and disposing of all or a portion of offshore oil and natural gas platforms, and capping pipelines. Estimating the future restoration and removal costs is difficult and requires management to make estimates and judgments. Asset removal technologies and costs are constantly changing, as are regulatory, political, environmental, safety, and public relations considerations.
A liability for ARO is recognized in the period in which the legal obligations are incurred if a reasonable estimate of fair value can be made. The ARO liability reflects the estimated present value of the amount of dismantlement, removal, site reclamation, and similar activities associated with our oil and natural gas properties. We use current retirement costs to estimate the expected cash outflows for retirement obligations. Inherent in the present value calculation are numerous assumptions and judgments including the ultimate settlement amounts, inflation factors, credit-adjusted discount rates, timing of settlement, and changes in the legal, regulatory, environmental, and political environments. Initial recordation of the ARO liability is offset by the corresponding capitalization of asset retirement cost recorded to oil and natural gas properties. To the extent these or other assumptions change after initial recognition of the liability, the fair value estimate is revised and the recognized liability adjusted, with a corresponding adjustment made to the related asset balance or income statement, as appropriate. Depreciation of capitalized asset retirement costs and accretion of asset retirement obligations are recorded over time. Depreciation is generally determined on a units-of-production basis for oil and natural gas production facilities, while accretion escalates over the lives of the assets to reach the expected settlement value.
ARO associated with retiring tangible long-lived assets is recognized as a liability in the period in which the legal obligation is incurred and becomes determinable. The liability is offset by a corresponding increase in the underlying asset. The ARO liability reflects the estimated present value of the amount of dismantlement, removal, site reclamation, and similar activities associated with our oil and natural gas properties. We use current retirement costs to estimate the expected cash outflows for retirement obligations. Inherent in the present value calculation are numerous assumptions and judgments including the ultimate settlement amounts, inflation factors, credit-adjusted discount rates, timing of settlement, and changes in the legal, regulatory, environmental, and political environments. To the extent future revisions to these assumptions impact the present value of the existing ARO liability, a corresponding adjustment is made to the oil and natural gas property balance. Accretion expense is recognized over time as the discounted liability is accreted to its expected settlement value.
NEW ACCOUNTING STANDARDS
See Note 4 to the consolidated financial statements.
41
Item 7A. Quantitative and Qualitative Disclosures About Market Risk
We are exposed to market risk, including the effects of adverse changes in commodity prices, foreign exchange rates and interest rates as described below.
Foreign Exchange Risk
Our results of operations and financial condition are affected by currency exchange rates. While oil sales are denominated in U.S. dollars, portions of our costs in Gabon and Angola are denominated in the respective local currency. A weakening U.S. dollar will have the effect of increasing costs while a strengthening U.S. dollar will have the effect of reducing costs. The Gabon local currency is tied to the Euro. The exchange rate between the Euro and the U.S. dollar has fluctuated widely in response to international political conditions, general economic conditions and other factors beyond our control. The exchange rate between the Angola local currency and the U.S. dollar has fluctuated for similar reasons, with the Angola local currency devaluing over recent quarters.
Interest Rate Risk
The floating rate on our IFC credit facility exposes us to risks associated with changes in interest rates and as such, future earnings are subject to change due to changes in this interest rate. At December 31, 2015 and 2014, we had borrowed $15.0 million under the IFC credit facility. Fluctuations in floating interest rates will cause our interest costs to fluctuate. During years ended December 31, 2015 and 2014, the average effective interest rate on our debt, excluding commitment fees, was 4.09% and 4.35%. If the balance of the debt at December 31, 2015 were to remain constant, a 1% change in market interest rates would impact our cash flow by an estimated $150,000 per year.
Commodity Price Risk
Our major market risk exposure continues to be the prices received for our oil and natural gas production. Sales prices are primarily driven by the prevailing market prices applicable to our production. Market prices for oil and natural gas have been volatile and unpredictable in recent years, and this volatility is expected to continue in the future. Beginning in the third quarter of 2014, the prices for oil and natural gas began a dramatic decline which continued through 2015, and current prices are significantly less than they have been over the last several years. Sustained low oil and natural gas prices or continued price decreases could have a material adverse effect on our financial condition, the valuation of our proved reserves and the borrowing base under our IFC credit facility. Were oil sales to remain constant at the most recently quarterly sales volumes of 456 MBbls, a $5 per Bbl decrease in oil price would be expected to cause a $2.3 million per quarter ($9.2 million annualized) reduction in revenues and operating income (loss) and a $1.5 million per quarter ($6.0 million annualized) reduction in net income (loss).
We have not used commodity price derivatives to hedge price risk in the years ended December 31, 2015, 2014 or 2013.
Item 8. Financial Statements and Supplementary Data
The information required here begins on page F-1 as described in “Item 15. Exhibits and Financial Statement Schedules—Index to Consolidated Financial Information”.
Item 9. Changes in and Disagreements with Accountants on Accounting and Financial Disclosure
None.
Item 9A. Controls and Procedures
Disclosure Controls and Procedures
We maintain disclosure controls and procedures that are designed to provide reasonable assurance that information required to be disclosed by us in the reports we file or submit under the Securities Exchange Act of 1934, as amended (the “Exchange Act”), is recorded, processed, summarized and reported within the time periods specified in the SEC’s rules and forms, and that such information is accumulated and communicated to our management, including the Chief Executive Officer and Chief Financial Officer, to allow timely decisions regarding required disclosure. In designing and evaluating our disclosure controls and procedures, management recognizes that any controls and procedures, no matter how well designed and operated, can provide only reasonable assurance of achieving the desired control objectives, and management was required to apply its judgment in evaluating and implementing possible controls and procedures. Management, including our principal executive officer and principal financial officer, has evaluated the effectiveness of our disclosure controls and procedures (as defined in Rules 13a-15(e) and 15d-15(e) under the Exchange Act) as of the end of the period covered by this Annual Report on Form 10-K. As described below, a material weakness was identified in our internal control over financial reporting. As a result of the material weakness, the Company’s principal executive officer and principal financial officer have concluded that the Company’s disclosure controls and procedures were not effective at December 31, 2015. Notwithstanding the identified material weakness, management believes the consolidated financial statements included in this Annual Report on Form 10-K fairly represent in all material respects our financial condition, results of operations and cash flows at and for the periods presented in accordance with U.S. GAAP.
42
Management’s Annual Report on Internal Control Over Financial Reporting
Our management, including our Chief Executive Officer and our Chief Financial Officer, is responsible for establishing and maintaining adequate internal control over financial reporting, as such term is defined in Rules 13a-15(f) and 15d-15(f) under the Exchange Act. Under the supervision and with the participation of management, including our principal executive and principal financial officers, we conducted an evaluation of the effectiveness of its internal control over financial reporting using the criteria set forth in the Internal Control — Integrated Framework (2013) issued by the Committee of Sponsoring Organizations of the Treadway Commission (the “COSO Framework”).
A company’s internal control over financial reporting is a process designed to provide reasonable assurance regarding the reliability of financial reporting and the preparation of financial statements for external purposes in accordance with generally accepted accounting principles. A company’s internal control over financial reporting includes those policies and procedures that (1) pertain to the maintenance of records that, in reasonable detail, accurately and fairly reflect the transactions and dispositions of the assets of the company; (2) provide reasonable assurance that transactions are recorded as necessary to permit preparation of financial statements in accordance with generally accepted accounting principles, and that receipts and expenditures of the company are being made only in accordance with authorizations of management and directors of the company; and (3) provide reasonable assurance regarding prevention or timely detection of unauthorized acquisition, use, or disposition of the company’s assets that could have a material effect on the financial statements.
Based on our evaluation under the COSO Framework, our management concluded that our internal control over financial reporting was not effective as of December 31, 2015 as a result of the identification of the material weakness described below. A material weakness is a deficiency, or a combination of deficiencies, in internal control over financial reporting such that there is a reasonable possibility that a material misstatement of the annual or interim financial statements will not be prevented or detected on a timely basis.
As described in the Annual Report on Form 10-K for the year ended December 31, 2014, our management identified the following control deficiencies that in aggregate constituted a material weakness in our internal control over financial reporting:
Control environment and internal controls over financial reporting due to insufficient financial reporting resources. We did not maintain an effective control environment based on the criteria established in the COSO Framework. As a result, we did not maintain effective internal control over financial reporting due to the failure to maintain a sufficient complement of corporate accounting and finance personnel necessary to consistently operate management review controls. We did not identify that the change in the complement of corporate accounting and finance personnel resulted in elevated risk that impacted our system of internal control, which in aggregate resulted in a material weakness. Controls were not operating effectively over the review and preparation of the financial statements. This material weakness resulted in adjustments prior to the issuance of the financial statements that, if not corrected, would have resulted in a material misstatement of the financial statements.
Management identified and began remediation measures to address this material weakness as described in the Remediation of Material Weaknesses section below,
The overall effectiveness of internal control over financial reporting was enhanced during 2015; however, the newly implemented controls were not operating effectively at December 31, 2015. As of December 31, 2015 the same material weakness exists. Until the remediation steps are fully implemented and operating effectively for a sufficient period of time, the material weakness described above will continue to exist.
Because of its inherent limitations, internal control over financial reporting may not prevent or detect misstatements. Also, projections of any evaluation of effectiveness to future periods are subject to the risk that controls may become inadequate because of changes in conditions, or that the degree of compliance with the policies or procedures may deteriorate.
Deloitte & Touche LLP, the independent registered public accounting firm, has issued their report on our internal control over financial reporting as of December 31, 2015, which is included in this Item under the heading “Report of Independent Registered Public Accounting Firm.”
43
Remediation of material weaknesses
As described in the Annual Report on Form 10-K for the year ended December 31, 2014, material weaknesses were identified in our internal control over financial reporting related to (1) internal control over the preparation and review of the impairment evaluation of oil and natural gas properties and (2) the control environment, risk assessment and internal controls over financial reporting due to insufficient financial reporting resources. Management identified the following measures to strengthen our internal control over financial reporting and to address these material weaknesses. We began implementing certain of these measures in the first quarter of 2015 and continued to develop remediation plans and implemented additional measures throughout the remainder of 2015, including:
|
· |
In March 2015, we hired an experienced corporate controller to fill a vacancy created during the fourth quarter of 2014. |
|
· |
We executed a plan to manage the impact of personnel turnover by enhancing the business understanding and relevant knowledge possessed by those responsible for ensuring proper management review and effective financial reporting controls. |
|
· |
We redesigned controls over management’s review of the evaluation of impairment testing of oil and natural gas properties to address the associated risks and further expanded the procedures for reviewing data used as inputs into the oil and natural gas properties impairment calculation. |
|
· |
We added a number of key controls, including additional controls related to reserve information, accruals, account reconciliations, account analyses and analytical reviews. |
|
· |
We improved the periodic financial close and reporting process through the use of a detailed financial close plan and expanded reporting of financial data to our senior management. |
We believe that the steps described above have enhanced the overall effectiveness of our internal control over financial reporting but the control environment and internal controls over financial reporting were not operating effectively at December 31, 2015 due to insufficient financial reporting resources.
Changes in internal control over financial reporting
Except for the remediation procedures detailed above for the previously identified material weaknesses discussed above, there have been no other changes in our internal control over financial reporting during the three months ended December 31, 2015 that have materially affected, or are reasonably likely to materially affect our internal control over financial reporting.
Management’s plan for remediation of THE material weakness
In response to the identified material weakness at December 31, 2015, our management, with oversight from our Audit Committee, is taking the following actions to remediate the material weakness described above:
|
· |
Continue the remediation plan discussed above specifically, refining key controls related to accruals, account balance reconciliations, account analyses and analytical reviews. |
|
· |
Continue to improve timing of the periodic financial close and reporting process through the use of a detail financial close plan and expanded reporting of financial data to senior management |
Management is committed to improving our internal control processes and believes that the measures described above should remediate the material weakness identified and strengthen internal control over financial reporting. As we continue to evaluate and improve internal control over financial reporting, additional measures to remediate the material weakness or modifications to certain of the remediation procedures described above may be necessary. We expect to complete the required remedial actions during 2016. While senior management and our Audit Committee are closely monitoring the implementation of these remediation plans, we cannot provide any assurance that these remediation efforts will be successful or that internal control over financial reporting will be effective as a result of these efforts. Until the remediation steps set forth above are fully implemented and operating for a sufficient period of time, the material weakness that exists at December 31, 2015 will continue to exist.
44
REPORT OF INDEPENDENT REGISTERED PUBLIC ACCOUNTING FIRM
To the Board of Directors and Stockholders of VAALCO Energy, Inc. and subsidiaries:
We have audited the internal control over financial reporting of VAALCO Energy, Inc. and subsidiaries (the “Company”) as of December 31, 2015, based on criteria established in Internal Control — Integrated Framework (2013) issued by the Committee of Sponsoring Organizations of the Treadway Commission. The Company’s management is responsible for maintaining effective internal control over financial reporting and for its assessment of the effectiveness of internal control over financial reporting, included in the accompanying Management’s Annual Report on Internal Control Over Financial Reporting. Our responsibility is to express an opinion on the Company’s internal control over financial reporting based on our audit.
We conducted our audit in accordance with the standards of the Public Company Accounting Oversight Board (United States). Those standards require that we plan and perform the audit to obtain reasonable assurance about whether effective internal control over financial reporting was maintained in all material respects. Our audit included obtaining an understanding of internal control over financial reporting, assessing the risk that a material weakness exists, testing and evaluating the design and operating effectiveness of internal control based on the assessed risk, and performing such other procedures as we considered necessary in the circumstances.
We believe that our audit provides a reasonable basis for our opinion.
A company’s internal control over financial reporting is a process designed by, or under the supervision of, the company’s principal executive and principal financial officers, or persons performing similar functions, and effected by the company’s board of directors, management, and other personnel to provide reasonable assurance regarding the reliability of financial reporting and the preparation of financial statements for external purposes in accordance with generally accepted accounting principles. A company’s internal control over financial reporting includes those policies and procedures that (1) pertain to the maintenance of records that, in reasonable detail, accurately and fairly reflect the transactions and dispositions of the assets of the company; (2) provide reasonable assurance that transactions are recorded as necessary to permit preparation of financial statements in accordance with generally accepted accounting principles, and that receipts and expenditures of the company are being made only in accordance with authorizations of management and directors of the company; and (3) provide reasonable assurance regarding prevention or timely detection of unauthorized acquisition, use, or disposition of the company’s assets that could have a material effect on the financial statements.
Because of the inherent limitations of internal control over financial reporting, including the possibility of collusion or improper management override of controls, material misstatements due to error or fraud may not be prevented or detected on a timely basis. Also, projections of any evaluation of the effectiveness of the internal control over financial reporting to future periods are subject to the risk that the controls may become inadequate because of changes in conditions, or that the degree of compliance with the policies or procedures may deteriorate.
A material weakness is a deficiency, or a combination of deficiencies, in internal control over financial reporting, such that there is a reasonable possibility that a material misstatement of the company’s annual or interim financial statements will not be prevented or detected on a timely basis. The following material weakness has been identified and included in management's assessment: the control environment and internal controls over financial reporting were not operating effectively due to insufficient financial reporting resources.
This material weakness was considered in determining the nature, timing, and extent of audit tests applied in our audit of the consolidated financial statements and financial statement schedule as of and for the year ended December 31, 2015 of the Company and this report does not affect our report on such financial statements and financial statement schedule.
In our opinion, because of the effect of the material weakness identified above on the achievement of the objectives of the control criteria, the Company has not maintained effective internal control over financial reporting as of December 31, 2015 based on the criteria established in Internal Control—Integrated Framework (2013) issued by the Committee of Sponsoring Organizations of the Treadway Commission.
We have also audited, in accordance with the standards of the Public Company Accounting Oversight Board (United States), the consolidated financial statements and financial statement schedule as of and for the year ended December 31, 2015 of the Company, and our report dated March 16, 2016 expressed an unqualified opinion on those consolidated financial statements and financial statement schedule and included an explanatory paragraph regarding the Company's recurring losses from operations and insufficient liquidity due to depressed oil and gas prices, raise substantial doubt about its ability to continue as a going concern.
/s/ DELOITTE & TOUCHE LLP
Houston, Texas
March 16, 2016
45
We have disclosed all information required to be disclosed in a current report on Form 8-K during the year ended December 31, 2015 in previously filed reports on Form 8-K.
Item 10. Directors, Executive Officers and Corporate Governance
Information required by this item will be included in the proxy statement for our 2016 annual meeting, which will be filed with the Commission within 120 days of December 31, 2015, and which is incorporated herein by reference.
Item 11. Executive Compensation
Information required by this item will be included in the proxy statement for our 2016 annual meeting, which will be filed with the Commission within 120 days of December 31, 2015, and which is incorporated herein by reference.
Item 12. Security Ownership of Certain Beneficial Owners and Management and Related Stockholder Matters
Information required by this item under Item 403 of Regulation S-K concerning the security ownership of certain beneficial owners and management will be included in the Company’s proxy statement for its 2016 annual meeting, which will be filed with the Commission within 120 days of December 31, 2015, and which is incorporated herein by reference. Please see “Item 5. Market for Registrant’s Common Equity, Related Stockholder Matters and Issuer Purchase of Equity Securities” for information on securities that may be issued under our stock incentive plans.
Item 13. Certain Relationships and Related Transactions, and Director Independence
Information required by this item will be included in the proxy statement for our 2016 annual meeting, which will be filed with the Commission within 120 days of December 31, 2015, and which is incorporated herein by reference.
Item 14. Principal Accountant Fees and Services
Information required by this item will be included in the proxy statement for our 2016 annual meeting, which will be filed with the Commission within 120 days of December 31, 2015, and which is incorporated herein by reference.
Item 15. Exhibits and Financial Statement Schedules
(a) 1. The following is an index to the financial statements that are filed as part of this Form 10-K.
|
|
|
|
VAALCO ENERGY, INC. AND SUBSIDIARIES |
|
|
F-1 |
|
|
F-2 |
|
|
F-3 |
|
|
F-4 |
|
|
F-5 |
|
|
F-6 |
|
|
S-1 |
(a) 2. Schedules are omitted because they are not required, not applicable or the required information is included in the financial statements or notes thereto.
46
(a) 3. Exhibits:
|
|
|
|
|
|
|
|
|
|
|
|
|
|
|
|
3.1 |
Certificate of Incorporation as amended through May 7, 2014 (filed as Exhibit 3.1 to the Company's Quarterly Report on Form 10-Q filed on November 10, 2014, and incorporated herein by reference). |
|
|
|
|
|
|
|
3.2 |
Second Amended and Restated Bylaws (filed as Exhibit 3.2 to the Company’s Current Report on Form 8-K filed on September 28, 2015, and incorporated herein by reference). |
|
|
|
|
|
|
|
3.3 |
First Amendment to the Second Amended and Restated Bylaws of VAALCO Energy, Inc., dated as of December 22, 2015 (filed as Exhibit 3.1 to the Company’s Current Report on Form 8-K filed on December 23, 2015, and incorporated herein by reference). |
|
|
|
|
|
|
|
3.4 |
Certificate of Elimination of Series A Junior Participating Preferred Stock of VAALCO Energy, Inc., dated as of December 22, 2015 (filed as Exhibit 3.2 to the Company’s Current Report on Form 8-K filed on December 23, 2015, and incorporated herein by reference). |
|
|
|
|
|
|
|
4.1 |
Form of Senior Debt Indenture (filed as Exhibit 4.1 to the Company’s Registration Statement on Form S-3 filed on May 13, 2014, and incorporated herein by reference). |
|
|
|
|
|
|
|
4.2 |
Form of Subordinated Debt Indenture (filed as Exhibit 4.2 to the Company’s Registration Statement on Form S-3 filed on May 13, 2014, and incorporated herein by reference). |
|
|
|
|
|
|
|
10.1 |
Exploration and Production Sharing Contract, dated July 7, 1995, between the Republic of Gabon and VAALCO Gabon (Etame), Inc. (filed as an exhibit to the Company’s Form 10-QSB for the quarterly period ended September 30, 1995, and incorporated by herein by reference). |
|
|
|
|
|
|
|
10.2 |
Addendum No. 1 to Exploration and Production Sharing Contract, dated July 7, 2001, between the Republic of Gabon and VAALCO Gabon (Etame), Inc. (filed as Exhibit 10.2 to the Company’s Annual Report on Form 10-K filed on March 16, 2015, and incorporated herein by reference). |
|
|
|
|
|
|
|
10.3 |
Addendum No. 2 to Exploration and Production Sharing Contract, dated July 7, 2006, between the Republic of Gabon and VAALCO Gabon (Etame), Inc. (filed as Exhibit 10.3 to the Company’s Annual Report on Form 10-K filed on March 16, 2015, and incorporated herein by reference). |
|
|
|
|
|
|
|
10.4 |
Addendum No. 3 to Exploration and Production Sharing Contract, dated November 26, 2009, between the Republic of Gabon and VAALCO Gabon (Etame), Inc. (filed as Exhibit 10.4 to the Company’s Annual Report on Form 10-K filed on March 16, 2015, and incorporated herein by reference). |
|
|
|
|
|
|
|
10.5 |
Addendum No. 4 to Exploration and Production Sharing Contract, dated January 5, 2012, between the Republic of Gabon and VAALCO Gabon (Etame), Inc. (filed as Exhibit 10.5 to the Company’s Annual Report on Form 10-K filed on March 16, 2015, and incorporated herein by reference). |
|
|
|
|
|
|
|
10.6 |
Trustee and Paying Agent Agreement, dated June 26, 2002, by and among VAALCO Gabon (Etame), Inc., J.P. Morgan Trustee and Depositary Company Limited and JPMorgan Chase Bank, London Branch (filed as Exhibit 10.3 to the Company’s Quarterly Report on Form 10-QSB filed on August 19, 2002, and incorporated herein by reference). |
|
|
|
|
|
|
|
10.7 |
Production Sharing Agreement, dated November 1, 2006, between Sonangol, E.P. and VAALCO Angola (Kwanza), Inc. (filed as Exhibit 10.8 to the Company’s Annual Report on Form 10-K filed on March 16, 2015, and incorporated herein by reference). |
|
|
|
|
|
|
|
10.8 |
Loan Agreement, dated January 30, 2014, between VAALCO Gabon (Etame), Inc. and International Finance Corporate (filed as Exhibit 10.1 to the Company’s Current Report on Form 8-K filed on February 4, 2014, and incorporated herein by reference). |
|
|
|
|
|
|
|
10.9 |
Waiver and First Amendment of Loan Agreement, by and between VAALCO Gabon (Etame), Inc. and International Finance Corporation, dated May 19, 2015 (filed as Exhibit 10.1 to the Company’s current report on Form 8-K filed on May 26, 2015, and incorporated herein by reference). |
|
|
|
|
|
|
|
10.10* |
Indemnity Agreement entered into among the Company and certain of its officers and directors listed therein (filed as an exhibit to the Company’s Form 10 (File No. 0-20928) filed on December 3, 1992, as amended by Amendment No. 1, filed as an exhibit to the Company’s Form 8 on January 7, 1993, and Amendment No. 2 filed as an exhibit to the Company’s Form 8 filed on January 25, 1993, and hereby incorporated by reference herein). |
47
|
|
|
|
|
|
|
10.11* |
VAALCO Energy, Inc. 2001 Stock Incentive Plan (filed as Exhibit 99.1 to the Company’s Registration Statement on Form S-8 filed on August 17, 2001, and incorporated herein by reference). |
|
|
|
|
|
|
|
10.12* |
Form of Award Agreement under the VAALCO Energy, Inc. 2001 Stock Incentive Plan (filed as Exhibit 10.12 to the Company’s Annual Report on Form 10-K filed on March 16, 2015, and incorporated herein by reference). |
|
|
|
|
|
|
|
10.13* |
VAALCO Energy, Inc. 2003 Stock Incentive Plan (filed as Exhibit 99.1 to the Company’s Registration Statement on Form S-8 filed on April 14, 2004, and incorporated herein by reference). |
|
|
|
|
|
|
|
10.14* |
Form of Award Agreement under the VAALCO Energy, Inc. 2003 Stock Incentive Plan (filed as Exhibit 10.14 to the Company’s Annual Report on Form 10-K filed on March 16, 2015, and incorporated herein by reference). |
|
|
|
|
|
|
|
10.15* |
VAALCO Energy, Inc. 2007 Stock Incentive Plan (filed as Exhibit 99.1 to the Company’s Registration Statement on Form S-8 filed on July 25, 2007, and incorporated herein by reference). |
|
|
|
|
|
|
|
10.16* |
Form of Nonstatutory Stock Option Agreement under the VAALCO Energy, Inc. 2007 Stock Incentive Plan (fined s Exhibit 10.16 to the Company’s Annual Report on Form 10-K filed on March 16, 2015, and incorporated herein by reference). |
|
|
|
|
|
|
|
10.17* |
VAALCO Energy, Inc. 2012 Long Term Incentive Plan (filed as Exhibit 10.1 to the Company’s Current Report on Form 8-K filed on May 30, 2012, and incorporated herein by reference). |
|
|
|
|
|
|
|
10.18* |
Form of Nonstatutory Stock Option Agreement under the VAALCO Energy, Inc. 2012 Long Term Incentive Plan (filed as Exhibit 10.18 to the Company’s Annual Report on Form 10-K filed on March 16, 2015, and incorporated herein by reference). |
|
|
|
|
|
|
|
10.19* |
VAALCO Energy, Inc. 2014 Long Term Incentive Plan (filed as Appendix A to the Company’s Definitive Proxy Statement on Schedule 14A filed on April 17, 2014, and incorporated herein by reference). |
|
|
|
|
|
|
|
10.20* |
Form of Restricted Stock Award Agreement under the VAALCO Energy, Inc. 2014 Long Term Incentive Plan (filed as Exhibit 10.20 to the Company’s Annual Report on Form 10-K filed on March 16, 2015, and incorporated herein by reference). |
|
|
|
|
|
|
|
10.21* |
Form of Nonstatutory Stock Option Agreement under the VAALCO Energy, Inc. 2014 Long Term Incentive Plan (filed as Exhibit 10.21 to the Company’s Annual Report on Form 10-K filed on March 16, 2015, and incorporated herein by reference). |
|
|
|
|
|
|
|
10.22* |
Form of Restricted Stock Award Agreement (for Directors) under the VAALCO Energy, Inc. 2014 Long Term Incentive Plan (filed as Exhibit 10.22 to the Company’s Annual Report on Form 10-K filed on March 16, 2015, and incorporated herein by reference). |
|
|
|
|
|
|
|
10.23* |
Severance and Consulting Agreement, dated June 4, 2014, between the Company and Robert L. Gerry III (filed as Exhibit 10.1 to the Company’s Current Report on Form 8-K filed on May 6, 2014, and incorporated herein by reference). |
|
|
|
|
|
|
|
10.24* |
Form of Consulting Agreement between the Company and W. Russell Scheirman, (filed as Exhibit 10.1 to the Company’s Current Report on Form 8-K filed on April 16, 2015, and incorporated herein by reference). |
|
|
|
|
|
|
|
10.25* |
Employment Agreement between the Company and Cary Bounds (filed as Exhibit 10.1 to the Company’s Current Report on Form 8-K filed on July 1, 2015, and incorporated herein by reference). |
|
|
|
|
|
|
|
10.26* |
Amended and Restated Executive Employment Agreement, effective September 29, 2015, between VAALCO Energy, Inc. and Steven P. Guidry. (filed as Exhibit 10.1 to the Company’s Current Report on Form 8-K filed on October 2, 2015, and incorporated herein by reference). |
|
|
|
|
|
|
|
10.27* |
Employment Agreement, effective October 12, 2015, between VAALCO Energy, Inc. and Gayla M. Cutrer (filed as Exhibit 10.3 to the Company’s Quarterly Report on Form 10-Q filed on November 9, 2015, and incorporated herein by reference). |
|
|
|
|
|
|
|
10.28* |
Employment Agreement, effective November 1, 2015, between VAALCO Energy, Inc. and Don O. McCormack (filed as Exhibit 10.4 to the Company’s Quarterly Report on Form 10-Q filed on November 9, 2015, and incorporated herein by reference). |
|
|
|
|
|
|
|
10.29* |
Employment Agreement, effective November 17, 2015, between VAALCO Energy, Inc. and Gregory Hullinger (filed as Exhibit 10.1 to the Company’s Current Report on Form 8-K filed on November 18, 2015, and incorporated herein by reference). |
48
|
|
|
|
|
|
|
10.30(a)* |
Executive Employment Agreement effective September 29, 2015, between VAALCO Energy, Inc. and Eric J. Christ. |
|
|
|
|
|
|
|
10.31 |
Settlement Agreement, dated as of December 22, 2015, by and among VAALCO Energy, Inc., Group 42, Inc. Mr. Paul A. Bell, Michael Keane, BLR Partners LP, BLRPart, LP, BLRGP Inc., Fondren Management, LP, FMLP Inc., The Radoff Family Foundation and Bradley L. Radoff Stockholder Agreement, dated as of December 22, 2015, by and among VAALCO Energy, Inc., Kornitzer Capital Management, Inc. and John C. Kornitzer (filed as Exhibit 10.12 to the Company’s Current Report on Form 8-K filed on December 23, 2015, and incorporated herein by reference). |
|
|
|
|
|
|
|
10.32 |
Stockholder Agreement, dated as of December 22, 2015, by and among VAALCO Energy, Inc., Kornitzer Capital Management, Inc. and John C. Kornitzer (filed as Exhibit 10.1 to the Company’s Current Report on Form 8-K filed on December 23, 2015, and incorporated herein by reference). |
|
|
|
|
|
|
|
10.33 |
VAALCO Energy, Inc. 2016 Stock Appreciate Rights Plan (filed as Exhibit 10.1 to the Company’s Current Report on Form 8-K filed on March 15, 2016, and incorporated herein by reference).. |
|
|
|
|
|
|
|
10.34 |
Form of Stock Appreciation Rights Agreement under the VAALCO Energy, Inc. 2016 Stock Appreciate Rights Plan(filed as Exhibit 10.2 to the Company’s Current Report on Form 8-K filed on March 15, 2016, and incorporated herein by reference). |
|
|
|
|
|
|
|
21.1(a) |
List of subsidiaries of the Company |
|
|
|
|
|
|
|
23.1(a) |
Consent of Deloitte & Touche LLP |
|
|
|
|
|
|
|
23.2(a) |
Consent of Netherland, Sewell & Associates, Inc. —Independent Petroleum Engineers |
|
|
|
|
|
|
|
31.1(a) |
Sarbanes-Oxley Section 302 certification of Principal Executive Officer. |
|
|
|
|
|
|
|
31.2(a) |
Sarbanes-Oxley Section 302 certification of Principal Financial Officer. |
|
|
|
|
|
|
|
32.1(b) |
Sarbanes-Oxley Section 906 certification of Principal Executive Officer. |
|
|
|
|
|
|
|
32.2(b) |
Sarbanes-Oxley Section 906 certification of Principal Financial Officer. |
|
|
|
|
|
|
|
99.1(a) |
Report of Netherland, Sewell & Associates, Inc. (International Properties) |
|
|
|
|
|
|
|
99.2(a) |
Report of Netherland, Sewell & Associates, Inc. (Domestic Properties) |
|
|
|
|
|
|
|
101.INS(a) |
XBRL Instance Document. |
|
|
|
|
|
|
|
101.SCH(a) |
XBRL Taxonomy Schema Document. |
|
|
|
|
|
|
|
101.CAL(a) |
XBRL Calculation Linkbase Document. |
|
|
|
|
|
|
|
101.DEF(a) |
XBRL Definition Linkbase Document. |
|
|
|
|
|
|
|
101.LAB(a) |
XBRL Label Linkbase Document. |
|
|
|
|
|
|
|
101.PRE(a) |
XBRL Presentation Linkbase Document. |
___________________________________
(a) Filed herewith
(b) Furnished herewith
* Management contract or compensatory plan or arrangement
49
SIGNATURES
In accordance with Section 13 or 15(d) of the Exchange Act, the registrant caused this report to be signed on its behalf by the undersigned, thereunto duly authorized.
|
VAALCO ENERGY, INC. |
|||
|
(Registrant) |
|||
|
By |
/s/ DON O. MCCORMACK |
||
|
Don O. McCormack |
|||
|
Chief Financial Officer |
|||
Dated March 16, 2016
In accordance with the Exchange Act, this report has been signed below on the 16th day of March, 2016, by the following persons on behalf of the registrant and in the capacities indicated.
|
Signature |
|
Title |
||
|
|
|
|
|
|
|
By: |
|
/s/ STEVEN P. GUIDRY |
|
Chief Executive Officer (Principal Executive Officer) and Director |
|
|
|
Steven P. Guidry |
|
|
|
By: |
|
/s/ DON O. MCCORMACK |
|
Chief Financial Officer (Principal Financial Officer) |
|
|
|
Don O. McCormack |
|
|
|
By: |
|
/s/ ELIZABETH D. PROCHNOW |
|
Chief Accounting Officer (Principal Accounting Officer) |
|
|
|
Elizabeth D. Prochnow |
|
|
|
By: |
|
/s/ ANDREW L. FAWTHROP |
|
Chairman of the Board and Director |
|
|
|
Andrew L. Fawthrop |
|
|
|
By: |
|
/s/ FREDERICK W. BRAZELTON |
|
Director |
|
|
|
Frederick W. Brazelton |
|
|
|
By: |
|
/s/ MICHAEL A. KEANE |
|
Vice Chairman and Director |
|
|
|
Michael A. Keane |
|
|
|
By: |
|
/s/ A. JOHN KNAPP, JR. |
|
Director |
|
|
|
A. John Knapp, Jr. |
|
|
|
By: |
|
/s/ JOHN J. MYERS, JR. |
|
Director |
|
|
|
John J. Myers, Jr. |
|
|
|
By: |
|
/s/ STEVEN J. PULLY |
|
Director |
|
|
|
Steven J. Pully |
|
|